We systematized Qullamaggie's momentum strategy. Does the raw signal work?
Kristjan Kullamägi turned a small account into tens of millions trading momentum breakouts — and he published the rules. We built a faithful systematic version on 1,500 US stocks. The result captures his exact signature, small losses and big winners. But raw, it barely makes money.
What this is. A clean-room systematic implementation of Kullamägi's publicly published rules, for analysis — no original content or code is copied; he is credited and linked. Daily data on the current S&P 1500, 2015–2026. This is part 1 of 3: build it faithfully and see if the raw signal has an edge.
The strategy, in his words
Kullamägi trades a handful of timeless setups. The core one — the breakout:
- Scan for the stocks up the most over 1-, 3- and 6-month windows — the current leaders.
- Wait for a big move (30–100%+) to settle into a tight, orderly consolidation that surfs the rising 10- and 20-day moving averages.
- Buy the breakout out of that base. Stop at the day's low, no wider than the stock's average daily range.
- Sell a third to a half after 3–5 days, then trail the rest with the 10/20-day MA — exit on the first close below it.
Plus the Episodic Pivot (an earnings/news gap-up) and a parabolic short (which is an intraday setup we cannot faithfully test on daily bars — so it's out of scope here). His own summary of the edge: a 25–30% win rate is fine — the money is in small losses and the occasional 5–20x winner.
How we systematized it
We turned the discretionary rules into mechanical ones: rank the universe by a composite 1/3/6-month return and keep the top 15% (the leaders); require an uptrend (price above a rising 10/20-day EMA) and a volatility-contracted base; enter on a breakout to a new 20-day high (or an EP gap-up on volume); stop at an ADR-based level; size each position so a stop costs ~0.75% of the account; and trail the winners out on the first close below the 10-day EMA. No discretion, no market-timing overlay — the raw signal, exactly as written.
The result: the right shape
First, the good news. The distribution of trade outcomes is exactly his signature:
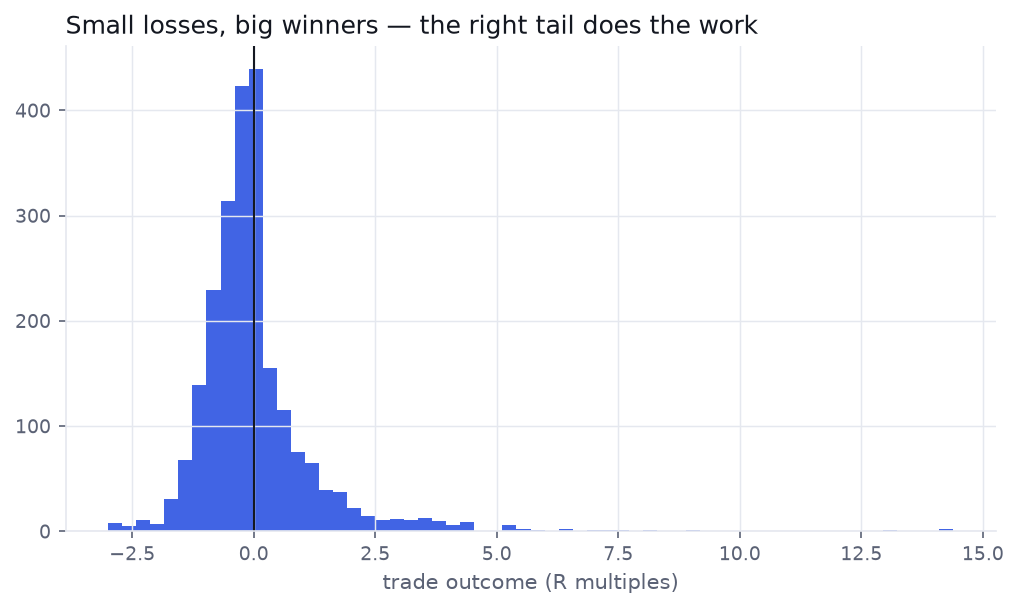
The mechanism is real: most trades are small losers, a few winners run for 5, 10, 14× the risk, and those carry the system. This is what a genuine momentum/trend edge looks like.
...and the bad news: raw, it barely works
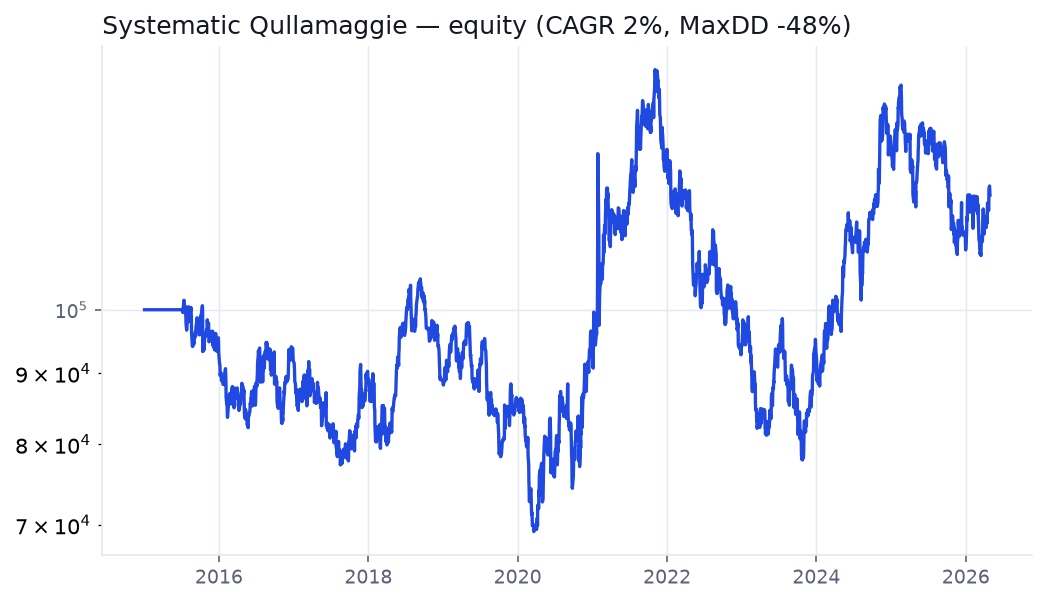
Now the equity curve. Over eleven years the strategy is a regime roller-coaster:
| Metric | Value |
|---|---|
| CAGR | 1.7% |
| Sharpe | 0.19 |
| Max drawdown | −47.6% |
| Win rate | 37% |
| Profit factor | 1.03 |
| Trades (11y) | 2,288 |
A profit factor of 1.03 and a −48% drawdown is not a strategy you can trade. The edge is in there — the right tail is real — but it is buried under whipsaw losses and, above all, a complete lack of market timing. The system happily buys breakouts into the teeth of a bear market, and 2018, 2020 and 2022 punish it for it.
What this tells us
The signal has the right shape — but the edge is in the wrapper.
The mechanical breakout reproduces Kullamägi's win/loss profile but not his returns. The gap is everything he does around the signal: sizing up in strong markets and sitting in cash in bad ones, selecting the cleanest setups by hand, and taking partial profits. Raw, the signal is a coin flip with a fat tail and a brutal drawdown.
And we are flattering it. Our universe is the current S&P 1500, so every stock that was delisted, acquired or went to zero is invisible — classic survivorship bias, which makes this result an optimistic upper bound. The honest number is worse than what you see above.
How much is survivorship, and where does the drawdown come from?
We pull the result apart: quantify the survivorship inflation, locate the drawdown in time and in market regime, test it out-of-sample, and deflate the headline for every parameter we tried. Then part 3 rebuilds it with the discipline — a regime filter, profit-taking, volatility sizing — to see whether the legend's edge can be made tradeable by a system.
Check the math yourself
ToolPosition Size & Risk of Ruin — survive a 37%-win-rate system with a −48% drawdown Tool
Deflated Sharpe Ratio — what does a momentum backtest survive after the search?