Analysis
We take a published strategy — a TradingView indicator, a YouTube system, an mql5 article — rebuild it properly in Python, and put it through honest validation: real costs, out-of-sample testing, and the Deflated Sharpe Ratio. Here's what survives, and what doesn't.
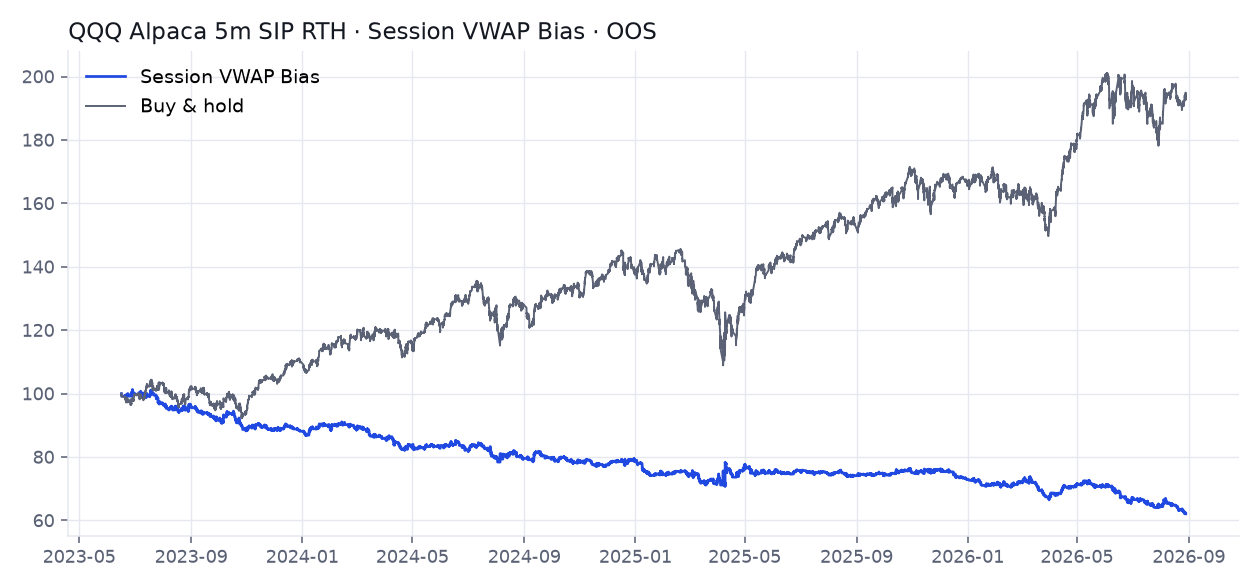
Does Session VWAP Bias day trading survive validation?
Zarattini–Aziz: long above session VWAP, short below, flat by the close. Clean-room on Alpaca SIP QQQ 5m/1m. OOS Sharpe −0.009871, DSR ≈ 0, survives false — costs invert the brochure.
Read the teardown →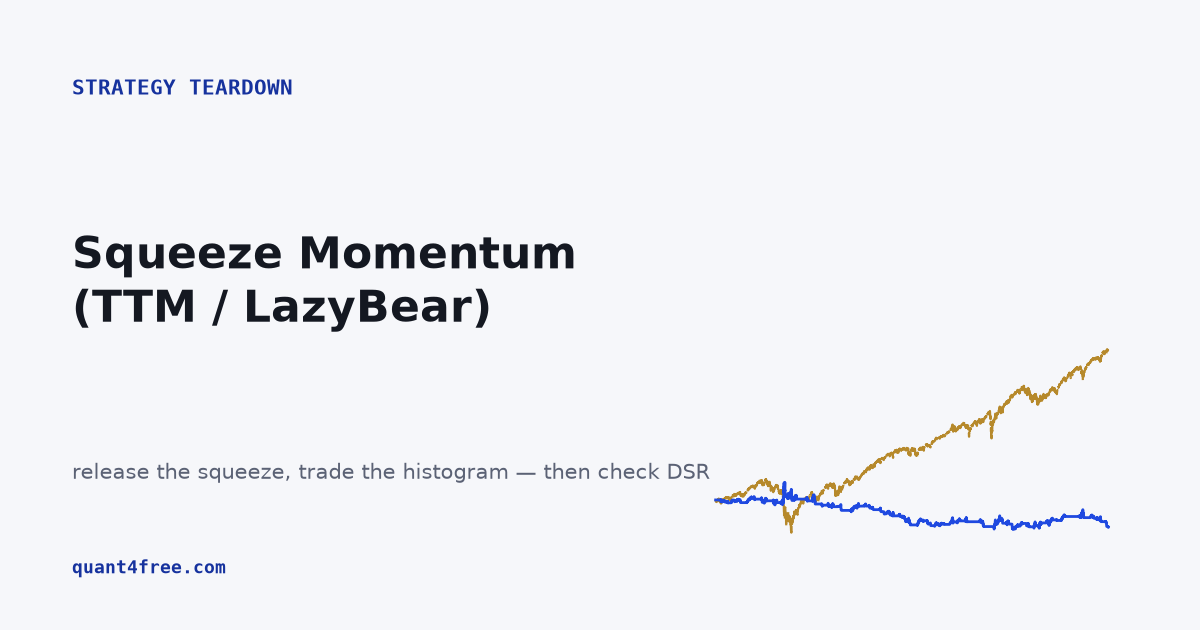
Does the Squeeze Momentum (TTM / LazyBear) actually work?
Bollinger inside Keltner, trade the release with linreg momentum. Clean-room on long-history SPY and QQQ daily. Gross Sharpe already negative; DSR ~0.12 / ~0.10. We still publish.
Read the teardown →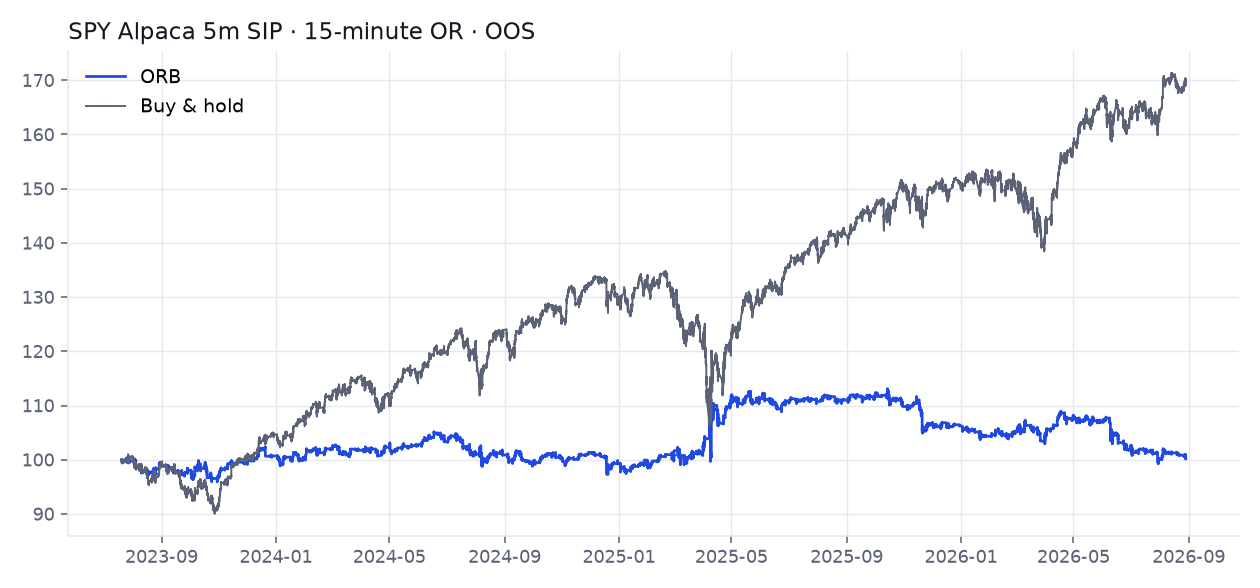
Does the NY 15-minute Opening Range Breakout survive validation?
Toby Crabel's opening range as the YouTube default: first 15 minutes, one break, done by the close. Clean-room on years of Alpaca SIP 5-minute SPY and QQQ. DSR 0.40 on SPY and 0.28 on QQQ — and the 60-day YouTube window is the wrong sample.
Read the teardown →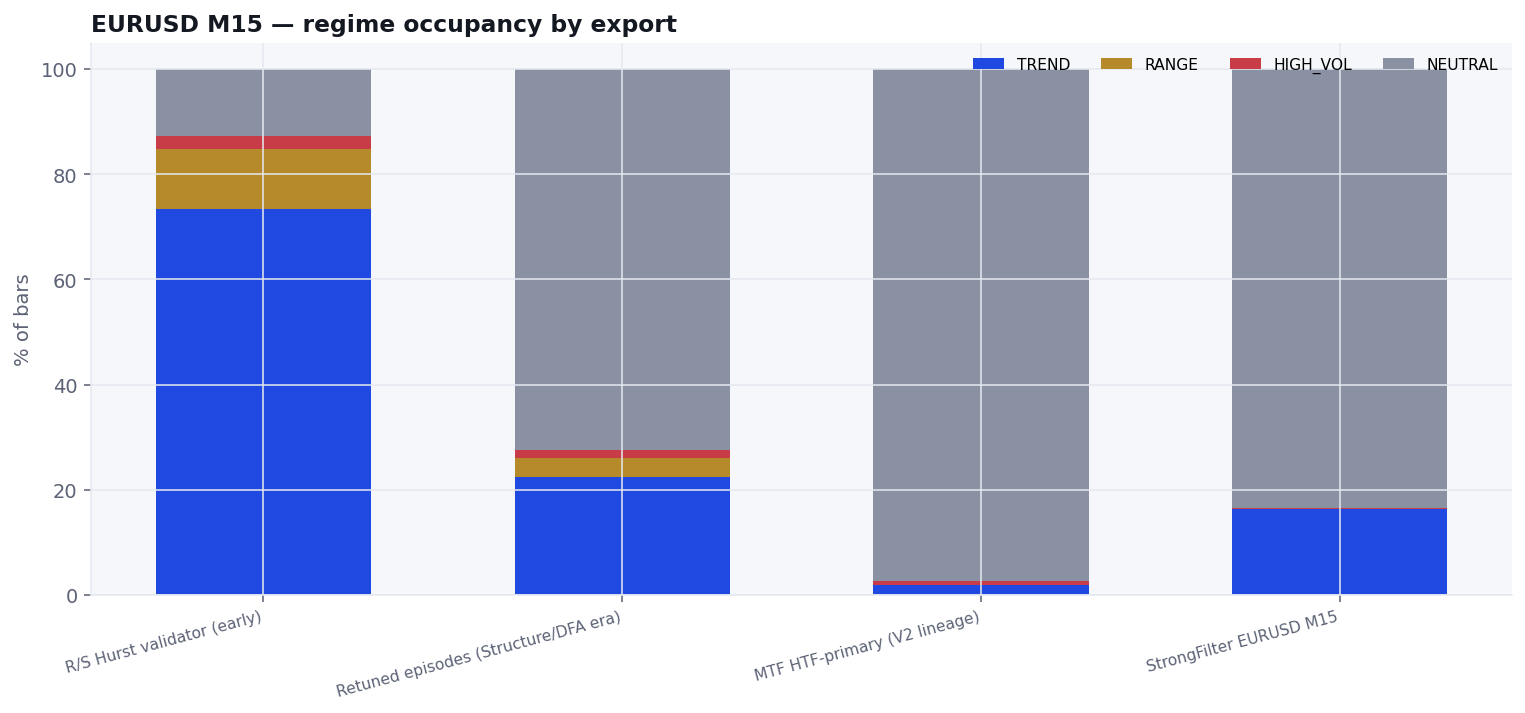
Can ADX/Hurst regime labels be trusted?
Real episode CSVs from an ADX/Hurst → multi-filter → HTF structure pipeline. Early labels over-call TREND and churn; tightening collapses into NEUTRAL and kills RANGE. Dual-regime switching does not emerge on this tape.
Read the teardown →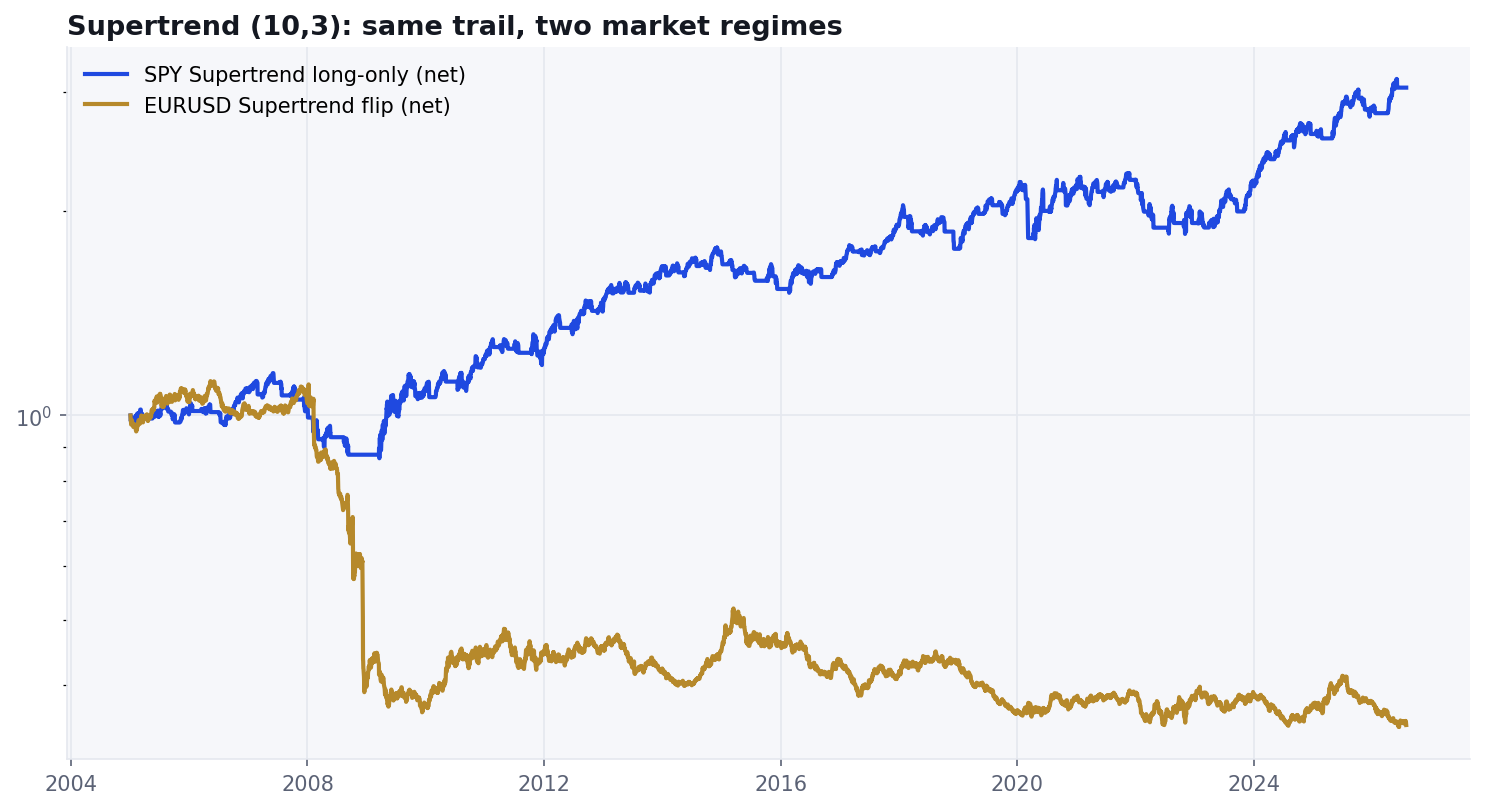
Does the Supertrend indicator actually work?
The viral ATR trail (10, 3), rebuilt clean-room and run on SPY's long uptrend and EURUSD's ranges. On equities it's a quieter, lower-return path; on FX it gets chopped. Regime decides more than the defaults — and the Deflated Sharpe doesn't clear the bar.
Read the teardown →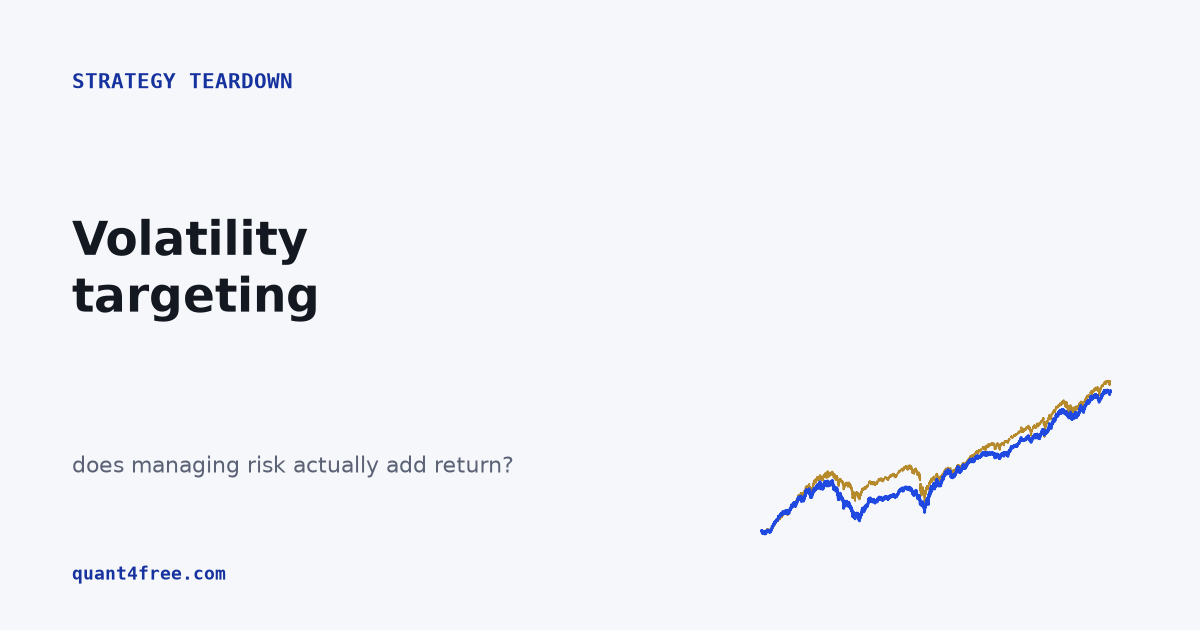
Does volatility targeting actually improve returns?
The engine inside risk parity and target-vol funds, sold as a free upgrade. Over 30 years of the S&P it moved the Sharpe by a rounding error, cost return, and helped only equities — though it did cushion the fast 2020 crash. Risk management, not free alpha.
Read the teardown →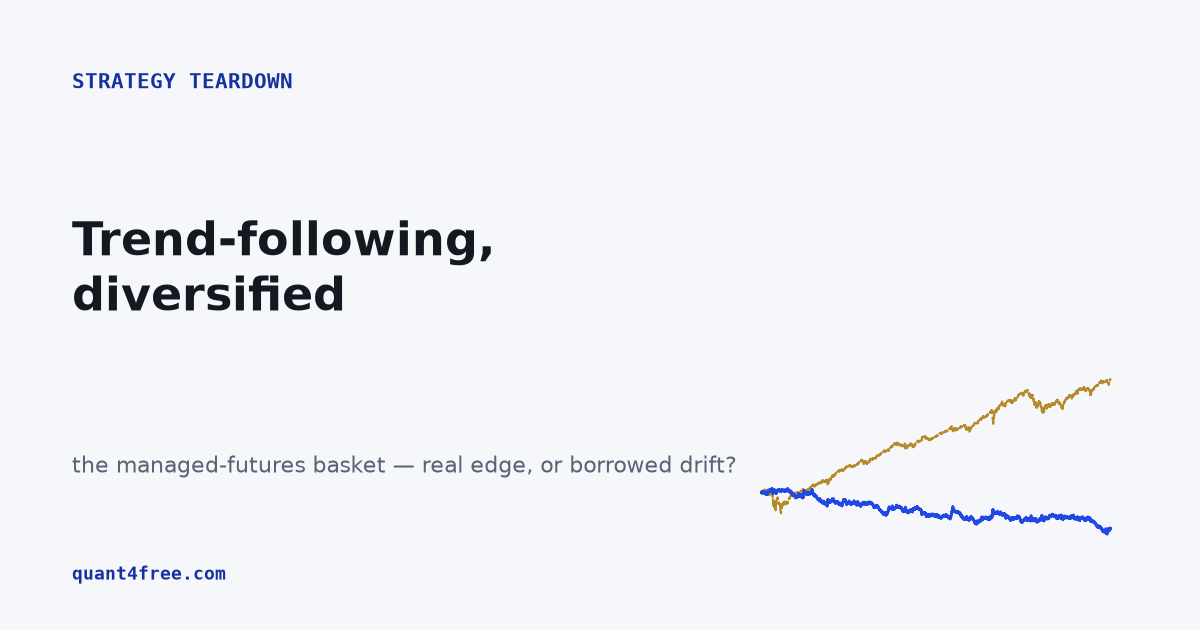
Does a diversified trend-following basket actually work?
Trend-following that failed on one market is meant to shine when you diversify it — long/short, vol-targeted, across asset classes, the managed-futures way. We built it from seven ETFs. It's a real crisis hedge (positive in 2008 and 2022) — but it lost to a boring 60/40, because you can't diversify an edge that isn't there.
Read the teardown →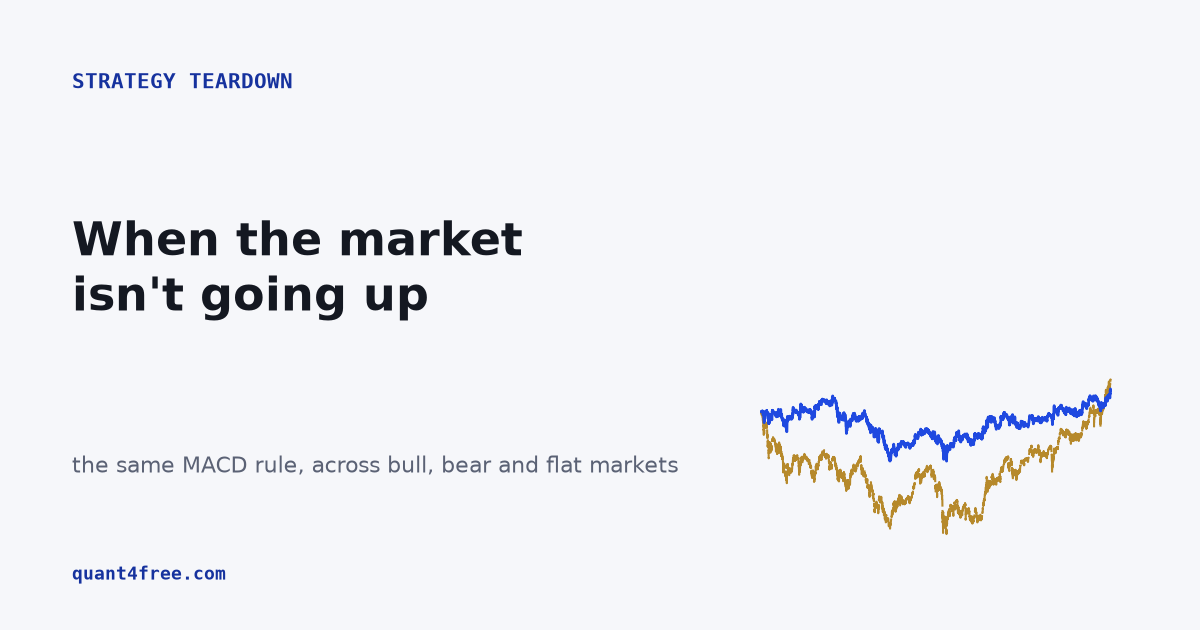
MACD across market regimes: was the benchmark the bias?
Our MACD test used the S&P — a market that only goes up, where no defensive rule can win. So we ran the identical rule across regimes: it lost on the S&P but protected capital through the Nikkei's lost decades, and bled on a driftless currency. Every backtest is a bet on the regime it ran in.
Read the teardown →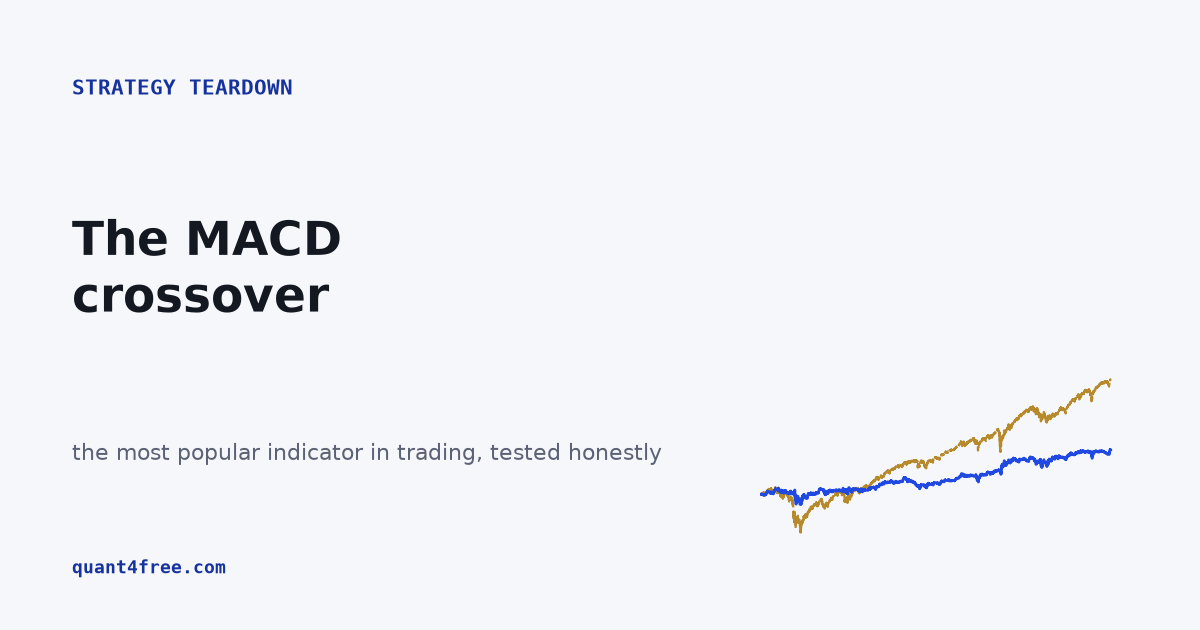
Does the MACD crossover actually work?
The most popular indicator in trading, tested two ways — as a market-timer on the S&P 500 and a signal across 1,500 stocks. It survives costs, but it's a lagging echo of price: as a timer it loses to holding half cash and never trading, and its famous 12/26/9 settings turn out to be arbitrary.
Read the teardown →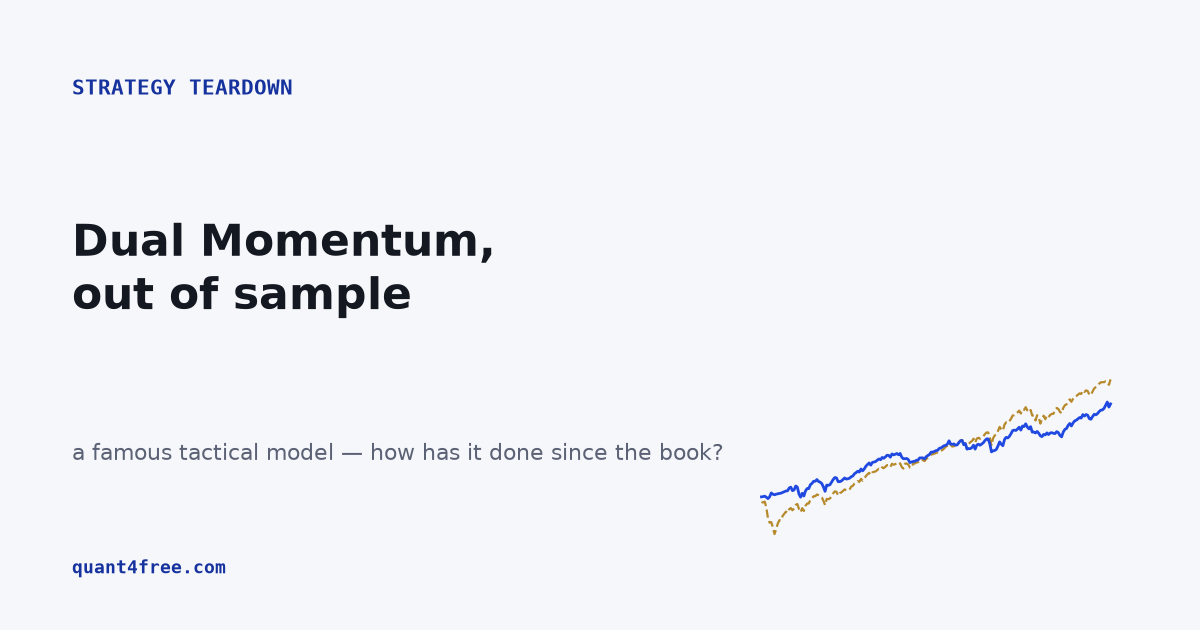
Dual Momentum out of sample: does GEM still beat buy-and-hold?
Gary Antonacci's famous tactical model, tested on the years since the book was published. It genuinely halved the 2008 drawdown — but out-of-sample it lagged a plain SPY by five points a year and gave up its drawdown edge to a static 60/40. Not broken, just beaten by boring.
Read the teardown →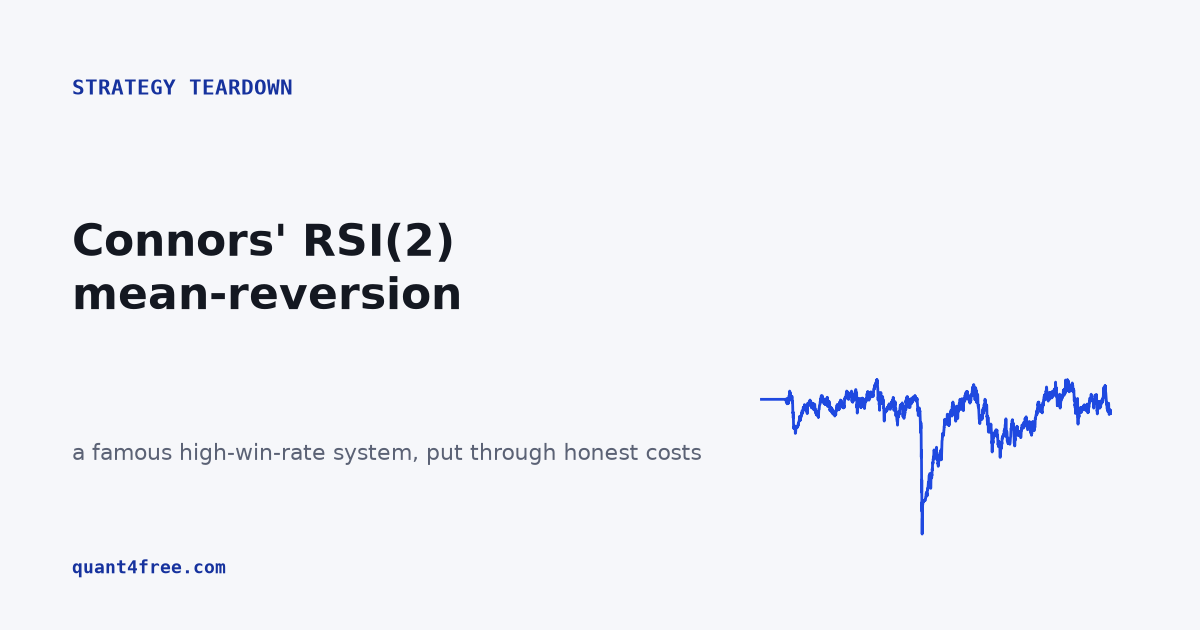
Does Connors' RSI(2) mean-reversion actually work?
A famous retail system with a real 63% win rate — rebuilt on 1,500 US stocks and put through honest costs. It trades 8,000 times, so friction erases the edge; it loses to buying SPY, craters −57% in 2020, and doesn't survive the Deflated Sharpe Ratio. Win rate is the most misleading number in trading.
Read the teardown →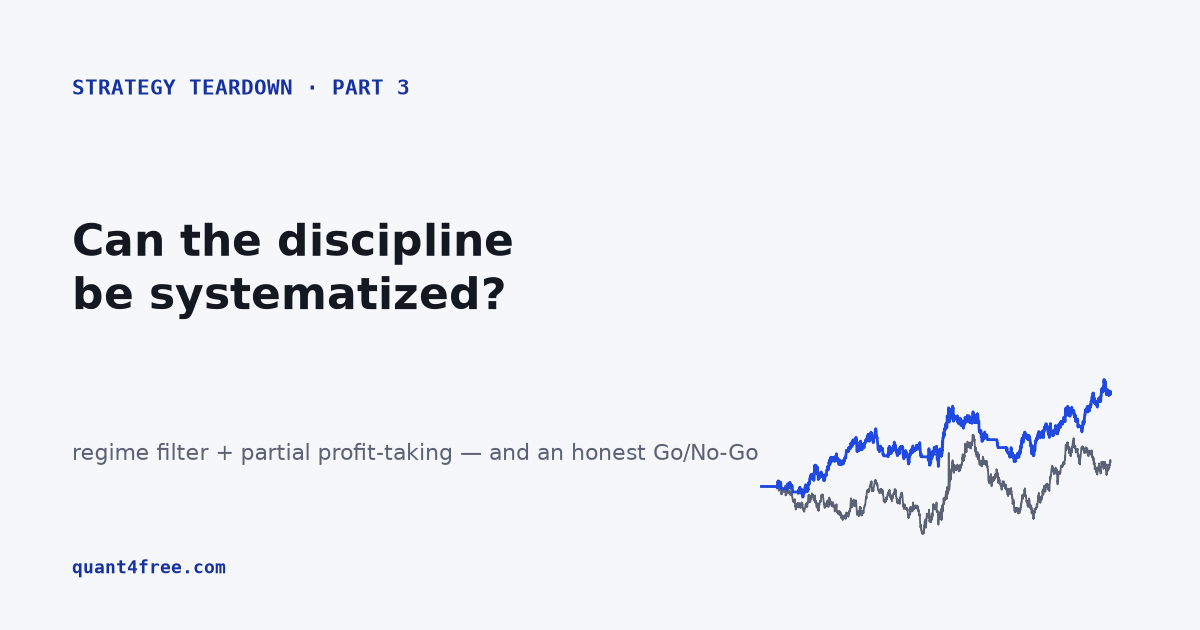
We rebuilt the Qullamaggie strategy with discipline. It still loses to the index.
We added the missing pieces — a regime filter, partial profit-taking, honest re-optimization. The improved build doubles the raw one and still loses to simply buying SPY on every axis, fails out-of-sample, and doesn't deflate. The alpha was the discretion all along. Part 3 of 3.
Read the finale →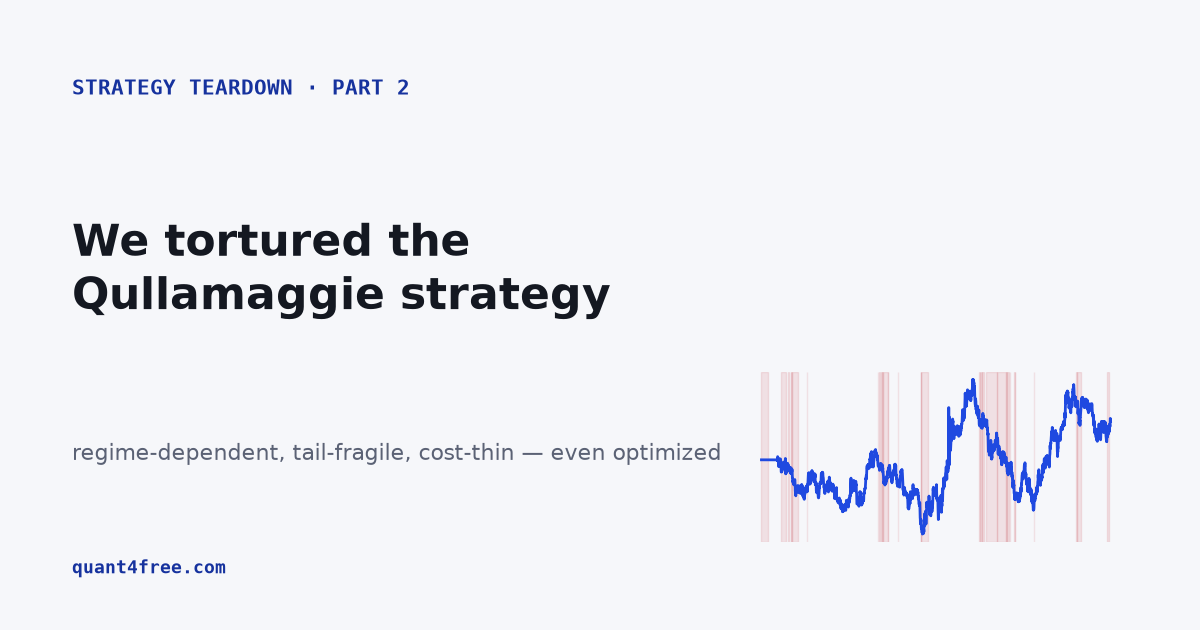
We tortured the Qullamaggie strategy. Where does its edge come from?
Four stress tests on the raw momentum strategy: the drawdown is a regime story, the profit lives in ten trades, the edge dies at ten basis points, and optimizing it doesn't survive the Deflated Sharpe Ratio. A faint, real edge — but not a tradeable one yet.
Read the teardown →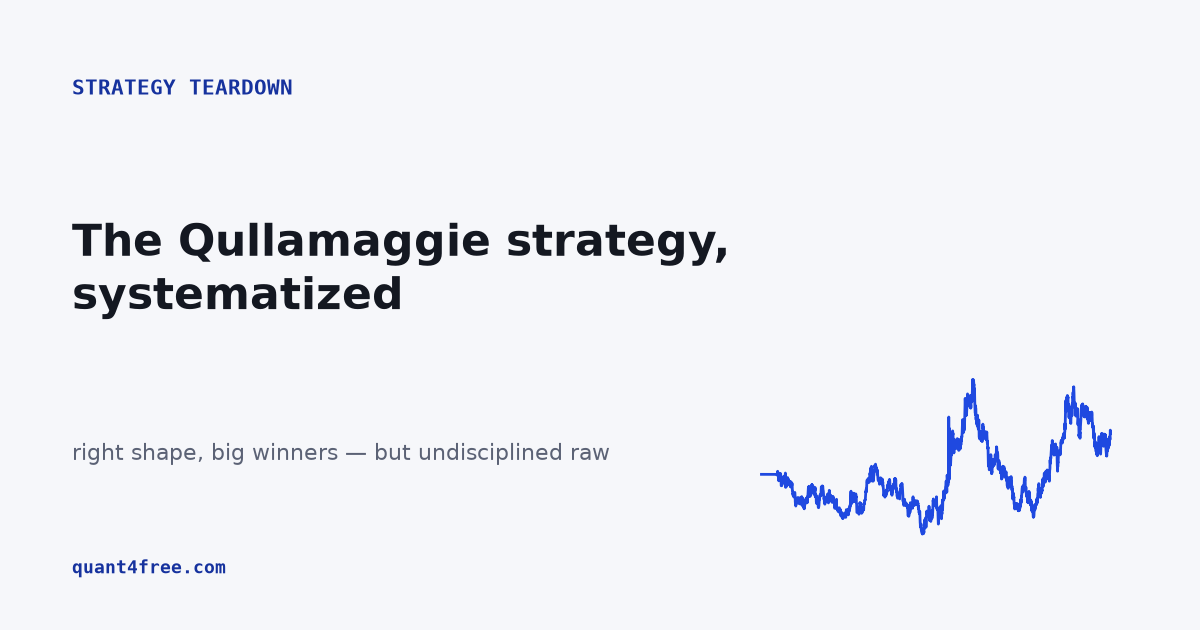
We systematized Qullamaggie's momentum strategy. Does the raw signal work?
Kristjan Kullamägi turned a small account into tens of millions on momentum breakouts — and published the rules. Our faithful systematic build on 1,500 US stocks reproduces his exact signature, small losses and big winners. But raw, it barely makes money. Part 1 of 3.
Read the teardown →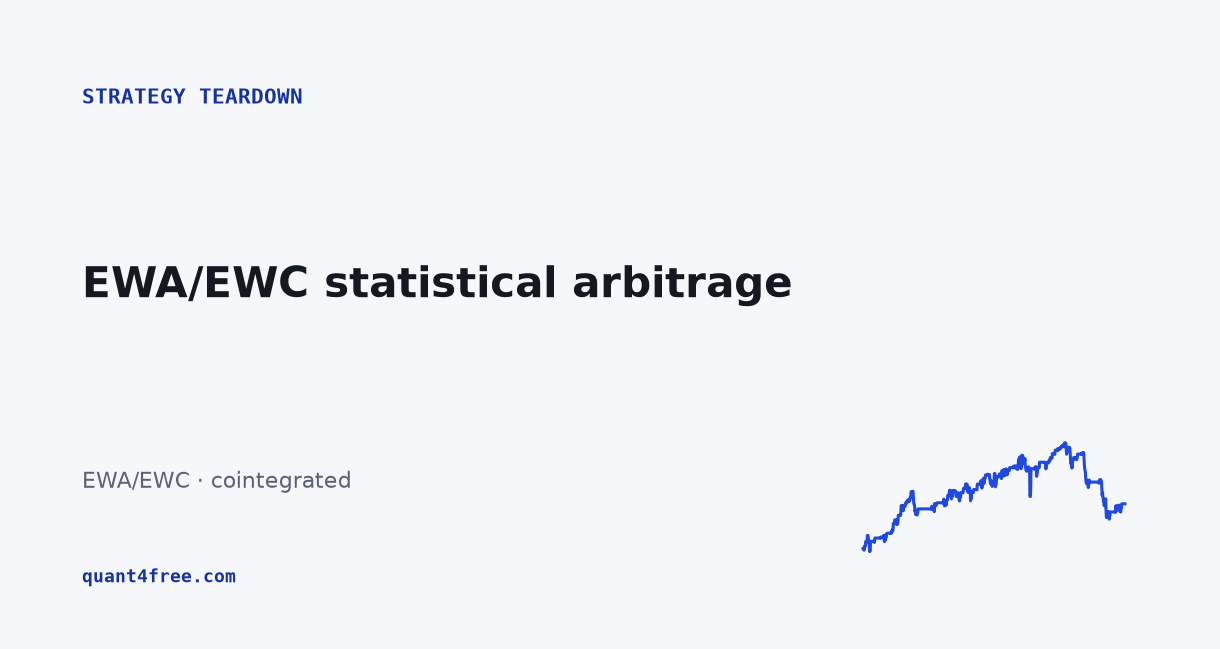
Statistical arbitrage done right: can a cointegrated pair clear the bar?
We screen eight pairs for cointegration (only three pass), deep-dive the textbook EWA/EWC pair, and judge it against a serious acceptance bar. Done right, the edge is real — but thin.
Read the teardown →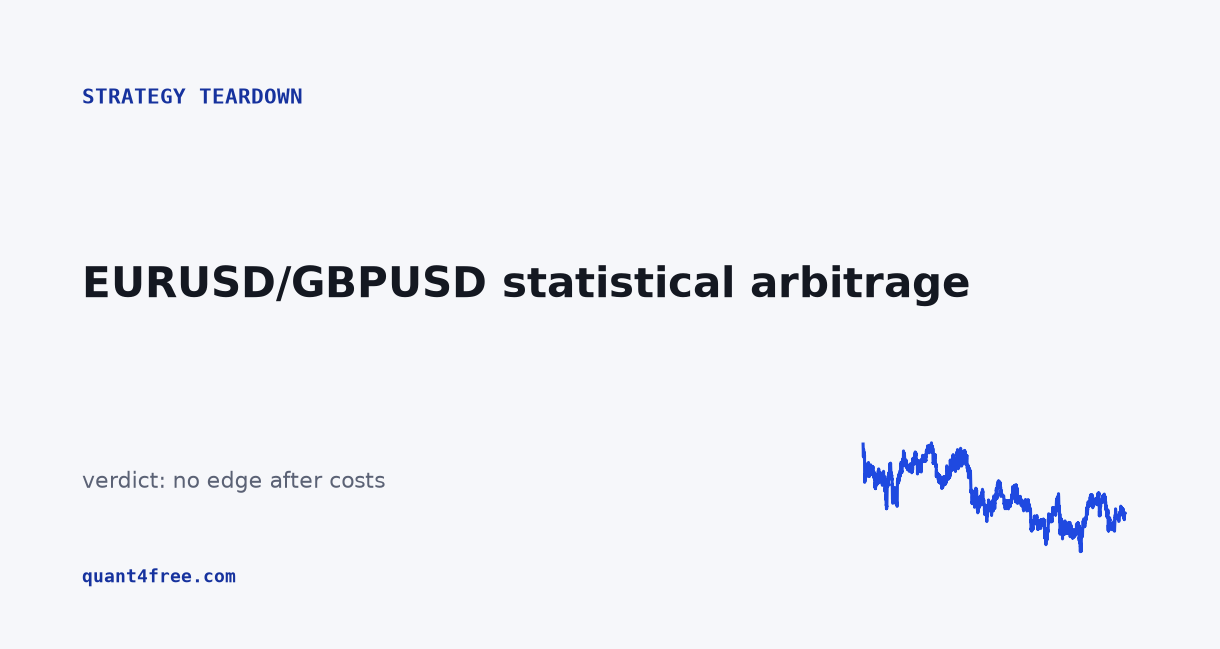
Does EURUSD/GBPUSD pairs trading actually work?
The legitimate cousin of triangular arbitrage. We tested it properly — cointegration test, out-of-sample, Deflated Sharpe. The two pairs move together, but correlation isn't cointegration, and there's no edge.
Read the teardown →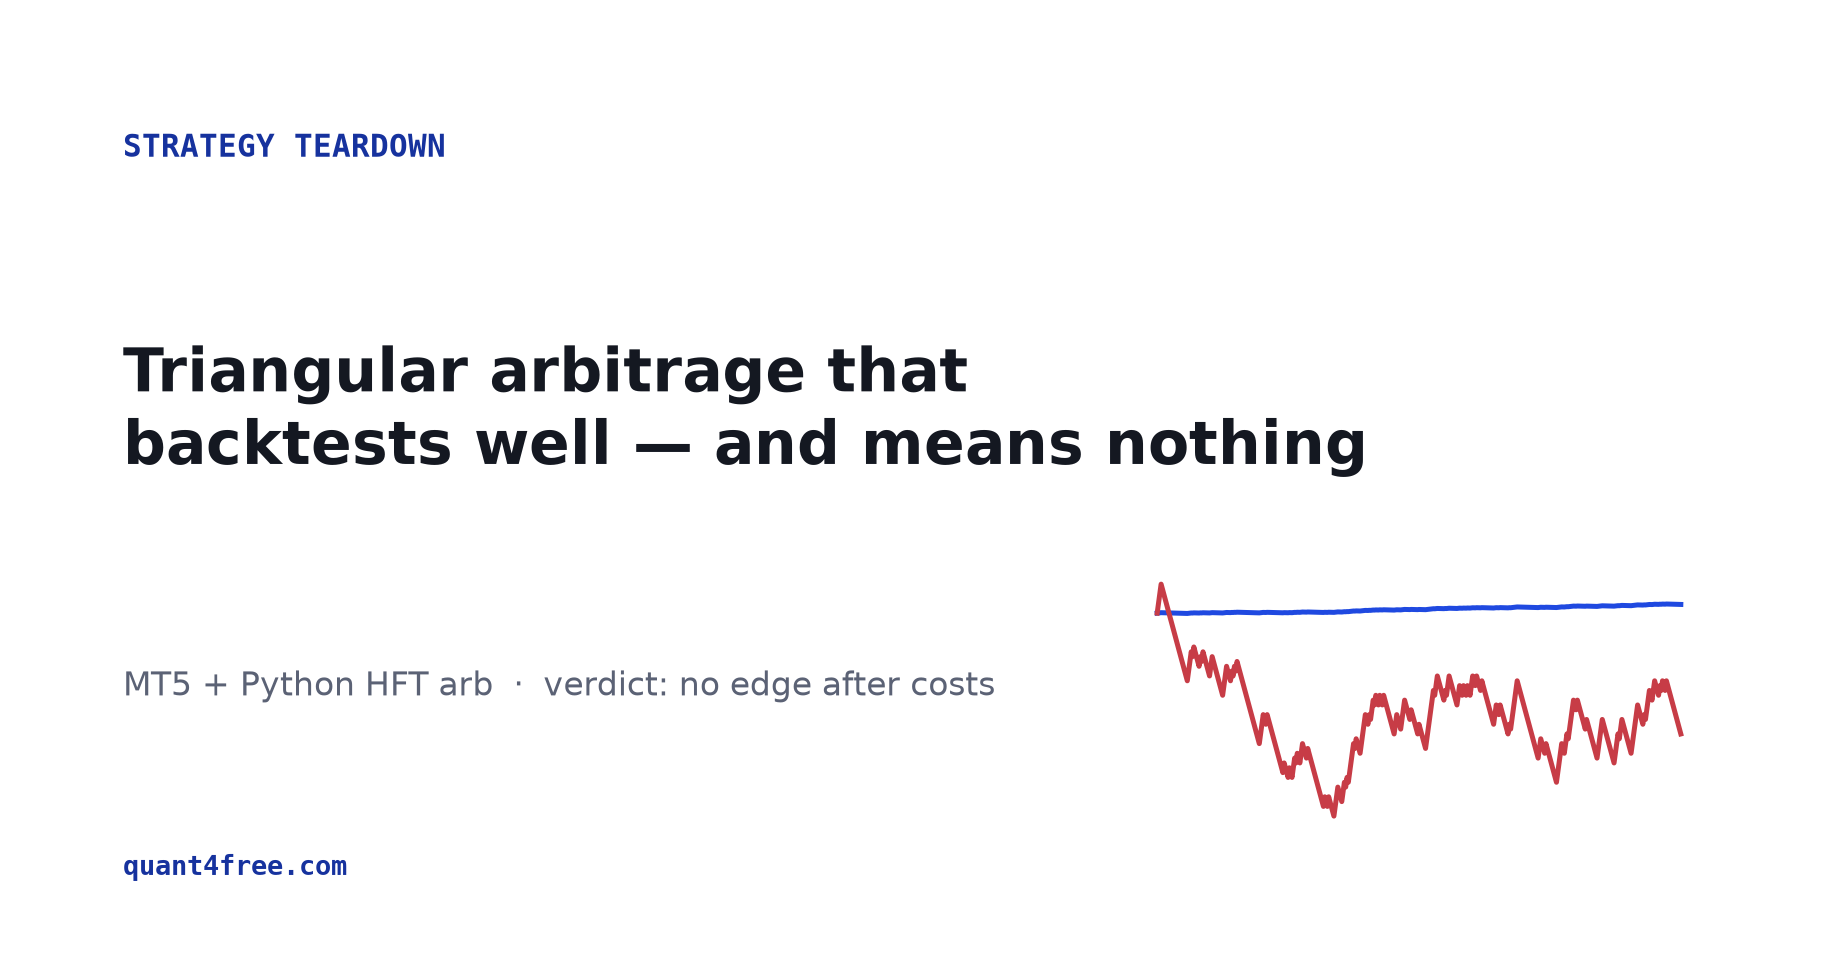
Triangular arbitrage in MT5 + Python: does it actually work?
A popular MetaTrader 5 system generates a thousand synthetic cross rates and ships a rising backtest curve. We rebuilt it on real tick data: the signal compares the wrong instruments, the backtest manufactures its profit, and the genuine edge is below cost.
Read the teardown →