Does volatility targeting actually improve returns?
Volatility targeting — cutting your exposure when markets get choppy, adding it back when they calm — is the engine inside risk parity and every "target-vol" fund, and it's sold as a nearly free upgrade to any portfolio. We ran it on 30 years of the S&P 500 and across five asset classes. It's a real tool, but a modest one, and it's oversold: it costs return, it only helps equities, and whether it protects you depends on how fast the crash arrives.
Where this comes from. In the trend-basket teardown we used vol-targeting as a building block. Here we turn it on itself. The idea is grounded in real research — Moreira & Muir's "Volatility-Managed Portfolios" (2017) — but the pitch has run far ahead of what it actually delivers.
1 / Thirty years on the S&P: the Sharpe barely moved
The rule: each day, scale your position so the portfolio's risk stays roughly constant — lever down when recent volatility is high, up when it's low. We target a stable ~1× average exposure and test two leverage caps: 2× (you can borrow to 200% in calm times) and 1× (de-risk only, never borrow). SPY, 1993–2026, small costs.
| SPY, 1993–2026 | CAGR | Sharpe | Max drawdown |
|---|---|---|---|
| Buy & hold | 10.8% | 0.64 | −55% |
| Vol-targeted (2× cap) | 9.9% | 0.66 | −59% |
| Vol-targeted (1× cap, de-risk only) | 9.0% | 0.69 | −48% |
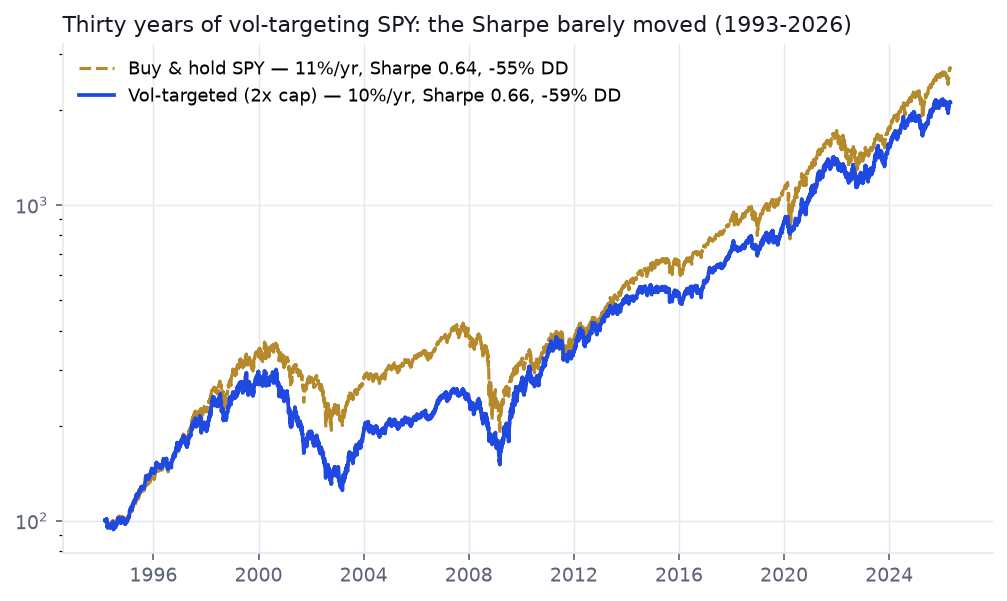
This is the first surprise. Over 30 years, full vol-targeting lifted the Sharpe from 0.64 to just 0.66 — a rounding error — while lowering the return, and its worst drawdown was actually a touch deeper (−59% vs −55%), because a 2× cap left it leveraged going into the slow 2000–2002 grind. Cap it at 1× instead — pure de-risking, never borrowing — and you get the best version: Sharpe 0.69, drawdown down to −48%. But look at the cost: return falls all the way to 9.0%. The leverage cap is the whole ballgame, and every version trades return for a smoother ride. None of them is free.
2 / Why it barely helps — and why it costs return
The theory says scaling down in high volatility should help, because high-vol periods have poor risk-adjusted returns. Half true. Here's what actually followed each volatility regime historically:
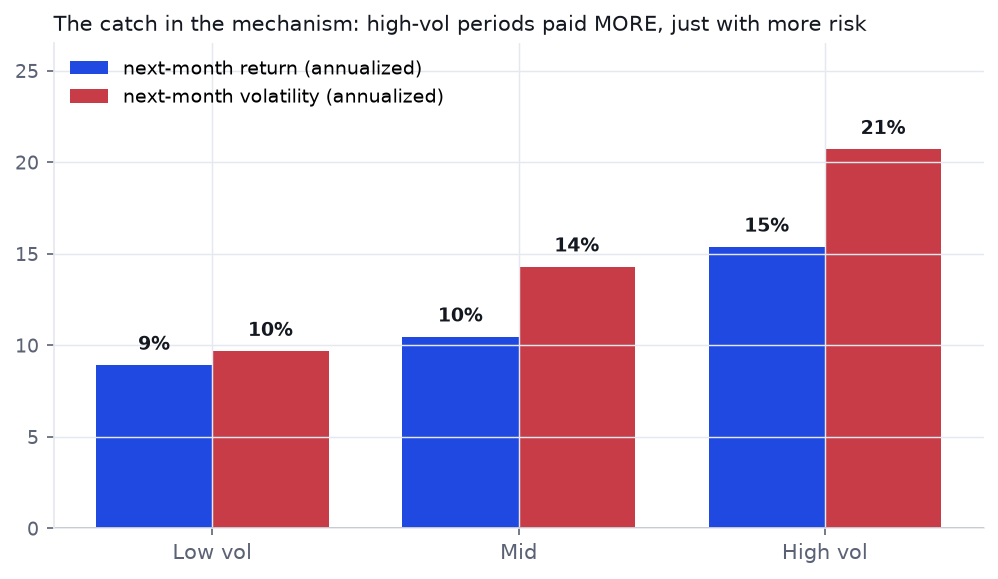
High volatility didn't predict bad returns — it predicted bigger ones (15% vs 9% annualized), because the scariest moments are also where the sharpest rebounds begin. What high vol predicted was disproportionately more risk (21% vs 10%). So vol-targeting works by shedding risk faster than it sheds return — which nudges the Sharpe up a hair, but forfeits those fat rebound returns. That forfeited upside is exactly why the vol-targeted return came in below buy-and-hold. It's a risk-reduction trade dressed up as a return strategy.
3 / It does cushion crashes — the fast ones most
Where vol-targeting earns its keep is inside a crash. But not equally:
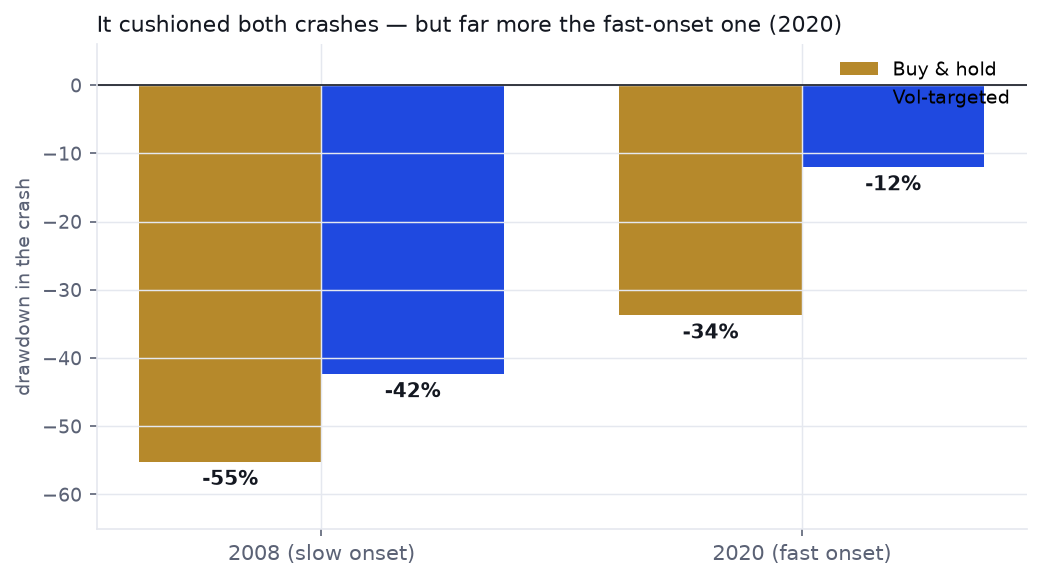
In the 2020 crash — a vertical, high-volatility drop — vol-targeting slashed the fall from −34% to −12%: volatility spiked instantly, so it de-risked instantly. But volatility is backward-looking. In the slow grind of 2008 (and worse, 2000–2002), the drop came before the volatility did, so the tool was still fully invested — even leveraged — as the first legs fell. It cushioned 2008 only modestly (−42% vs −55%), and over the full history that early-leg leverage is what produced the deeper drawdown you saw above. It's downside protection you can't fully count on, because it only reacts once the damage has started.
4 / And it only works on stocks
The whole effect is an equities phenomenon. Apply the identical rule across asset classes (2008–2026):
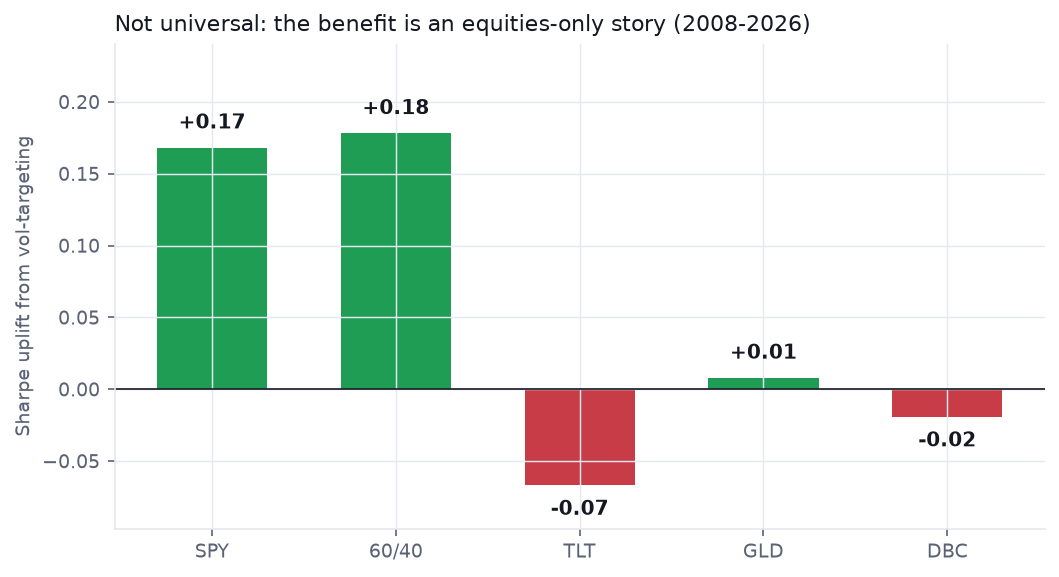
Stocks (+0.17) and a stock-heavy 60/40 (+0.18) improved; Treasuries got worse (−0.07), and gold and commodities were untouched. The reason is that equity volatility clusters and carries information — calm begets calm, storms cluster — in a way that bond and commodity volatility does much less. Reach for vol-targeting on your bond sleeve and you're likely making it worse. It is not a universal risk dial; it's an equity-specific one.
Risk management, not free alpha.
Volatility targeting is a genuine tool, and for an equity portfolio it does something real: it steadies your volatility, nudges the Sharpe up, and can dramatically cushion a fast crash like 2020. But the pitch oversells all of it. Over 30 years it moved the Sharpe by a rounding error; it always cost return (you forfeit the fat rebounds that follow high vol); its drawdown benefit flips with your leverage cap and with how fast the crash arrives; and outside equities it doesn't help at all. Use it to sleep better and to size fast-crash risk — not to earn more — and know that the one knob that matters is how much leverage you'll allow. Managing risk is worth doing. Just don't mistake it for making money.
Put a number on the risk you're actually managing
Related · TeardownThe diversified trend basket — where vol-targeting is used as a building block, and where it also disappoints Tool
Position Size & Risk of Ruin — decide how much exposure and drawdown you can actually live with Learn · Module 2
Performance metrics — what the Sharpe ratio does and doesn't tell you about a smoother equity curve