Does a diversified trend-following basket actually work?
A trend signal that loses on one market is supposed to come alive when you diversify it — long and short, volatility-targeted, spread across asset classes, the way managed-futures funds trade. We built exactly that from seven ETFs and put it up against a boring 60/40. It turns out to be a genuine crisis hedge with almost no correlation to stocks — and a poor way to make money.
Where this comes from. After testing MACD across market regimes, one fair objection remained: no professional runs a trend signal on a single index long-or-cash. They run it diversified, long/short, vol-targeted — the "time-series momentum" strategy documented by Moskowitz, Ooi & Pedersen (2012) and sold as managed futures. So let's give trend-following its best, fairest shot.
1 / Building it the professional way
We assembled a basket of seven liquid ETFs across five asset classes — US, developed and emerging equities (SPY, EFA, EEM), Treasuries (TLT), gold (GLD), broad commodities (DBC) and the US dollar (UUP). On each one, every day:
- Signal — go long if MACD is above its signal line, short if below. A trend bet in either direction, on every market.
- Vol-targeting — size each position so every sleeve contributes about the same risk (~10% annualized), then equal-risk-combine all seven. This is the core of the managed-futures method.
And because the popular MACD is a fast signal, we also ran the academic standard — a slow 12-month time-series momentum signal — as a fair-shot comparison. Costs of 5 bps per trade, 2008–2026.
2 / The result: it lost to a boring 60/40
| 2008–2026, net | CAGR | Sharpe | Max drawdown |
|---|---|---|---|
| Trend basket — MACD signal | −1.6% | −0.24 | −30% |
| Trend basket — 12-month signal | +1.0% | 0.21 | −13% |
| Static 60/40 (SPY/TLT) | +8.9% | 0.80 | −29% |
| SPY buy & hold | +11.5% | 0.65 | −51% |
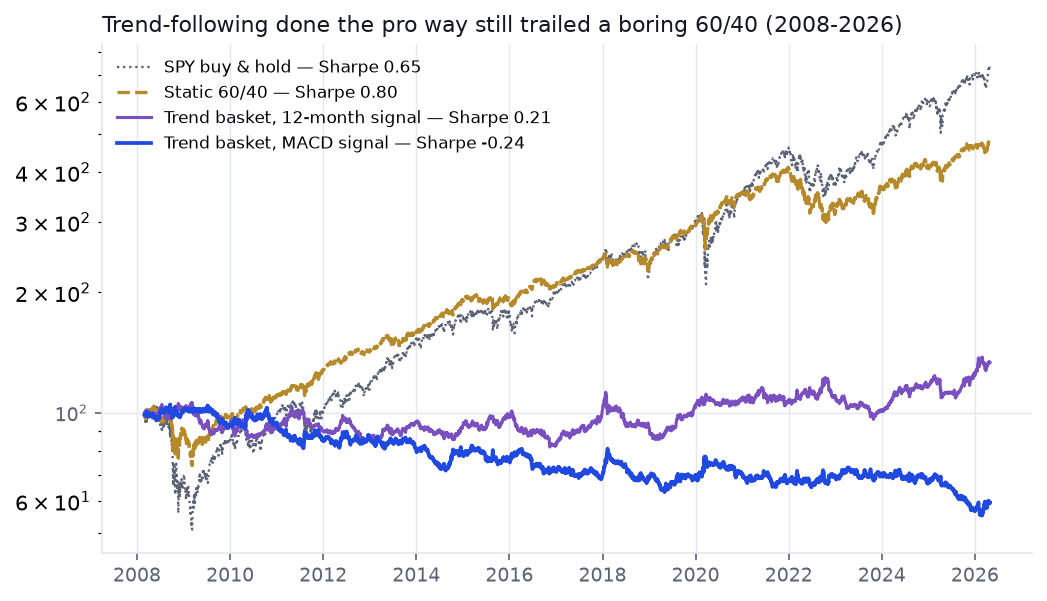
The popular version lost outright: the MACD basket returned −1.6% a year (Sharpe −0.24). Swapping in the slower, academic 12-month signal helped — but only to +1.0% a year (Sharpe 0.21), still a fraction of what a two-fund 60/40 you never touch delivered (8.9%, Sharpe 0.80). That the fast signal loses and the slow one merely limps is itself a lesson: MACD was never the right tool for trends, and even the right tool was modest here.
3 / Why diversification didn't rescue it
The pitch for a basket is diversification — the one "free lunch" in finance. But watch what it actually did. Here's each sleeve's own trend Sharpe, against the combined basket:
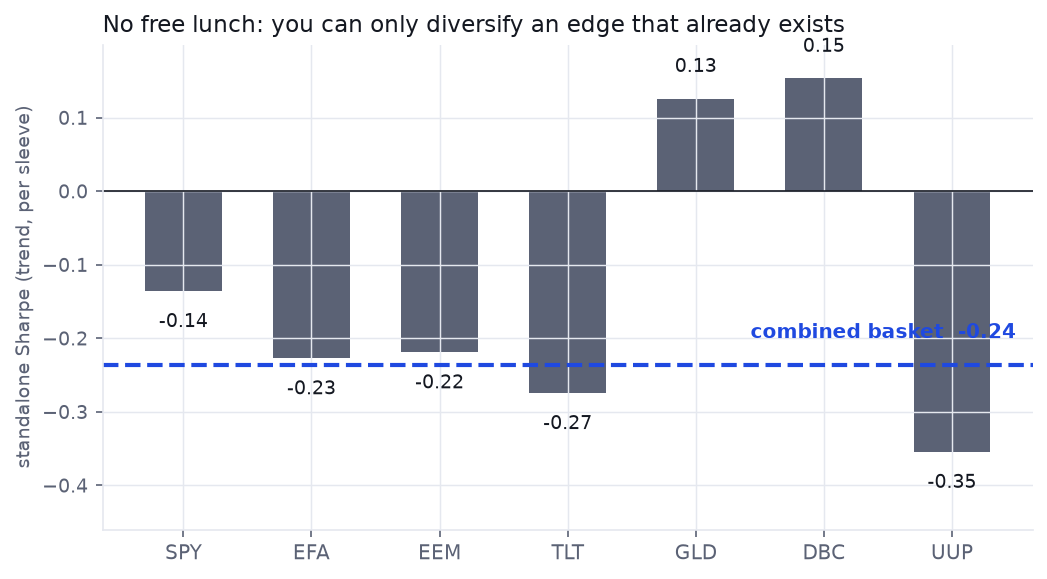
Only gold (+0.13) and commodities (+0.15) had any positive trend edge at all; MACD on equities, bonds and the dollar simply whipsawed and bled. Combine seven sleeves that mostly lose, and you get a basket that loses (Sharpe −0.24 — actually worse than the −0.13 average of its parts). This is the quiet truth behind "diversification is a free lunch": it lowers your volatility, but it can't manufacture a return that isn't there. You can only diversify an edge that already exists — and for most of these markets, it didn't.
4 / The one thing that did work: crisis insurance
And yet the basket is not useless — because of when its returns showed up. Its correlation to the S&P was −0.17: essentially a different, slightly opposite return stream. Look at the calendar years stocks fell:
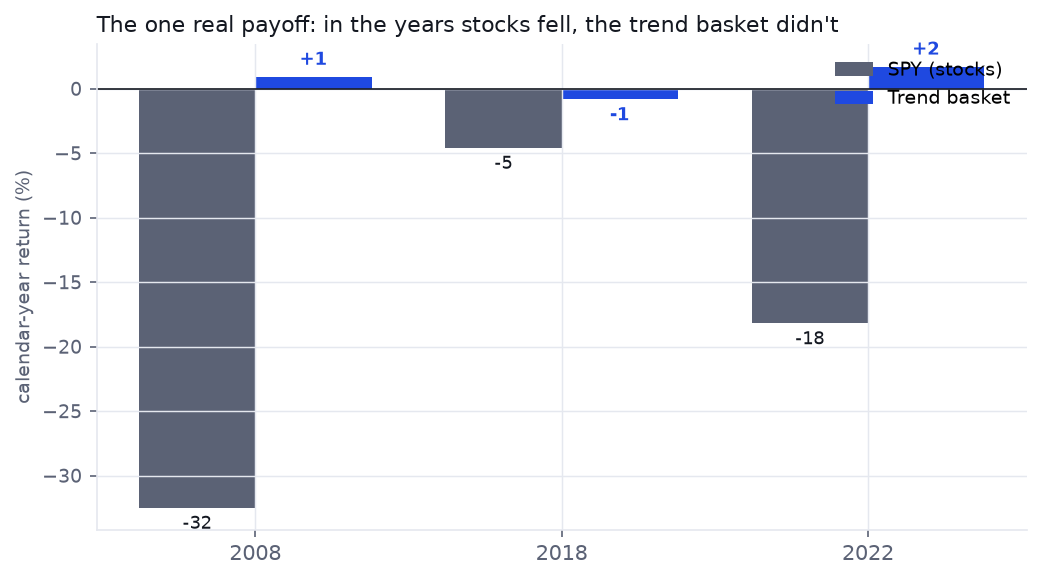
In 2008 the basket returned +1% while the S&P lost 32%; in 2022 it made +2% while stocks fell 18% and bonds fell with them — the year a 60/40 had nowhere to hide. That is genuine crisis alpha: a payoff that arrives exactly when your other assets are in trouble. It's the real reason institutions pay for managed futures — not for the return, but for the shape of the return.
5 / The catch: you bleed for years between crises
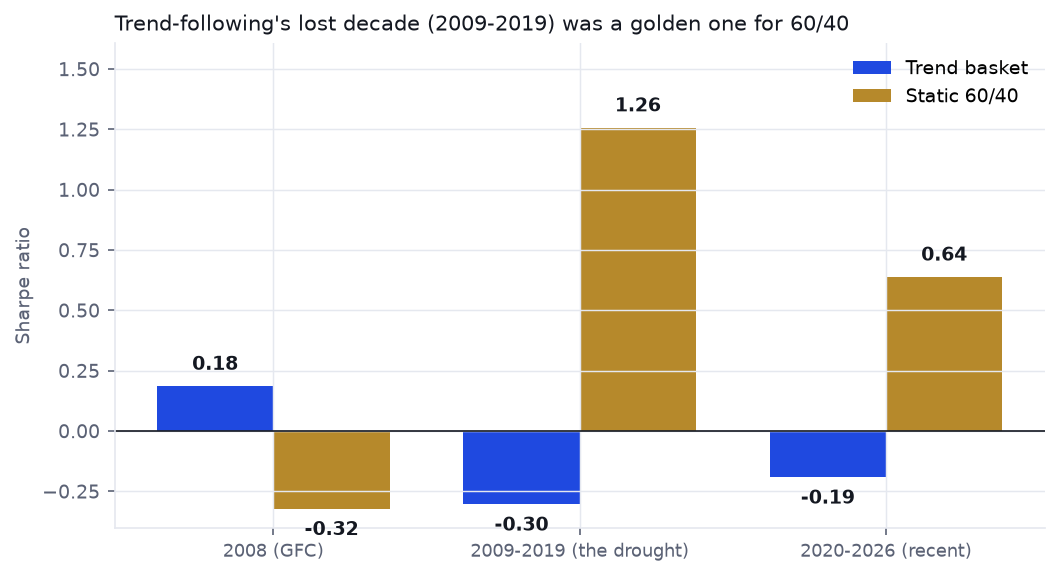
Insurance has a premium, and here it is. The basket's single winning stretch was the 2008 crisis (Sharpe +0.18 while a 60/40 lost). But through the long calm of 2009–2019 it bled (−0.30) while the boring 60/40 posted a golden decade (+1.26) — and it kept losing into the 2020s. To collect the occasional crisis payout, you'd have had to sit through ten-plus years of watching a two-fund portfolio trounce you. Almost nobody actually holds a strategy through that.
6 / Being fair to trend-following
Two caveats keep this honest, because our proxy is a floor, not a ceiling. First, signal speed matters: the slow 12-month rule beat the fast MACD by nearly half a Sharpe point — the popular indicator is simply the wrong tool. Second, a real managed-futures fund trades 50–100+ instruments across global futures — dozens of commodities, currencies and bond markets we can't reach through seven ETFs — which is far more independent bets and genuinely more diversification than we could build. And 2009–2019 was a documented, industry-wide trend-following drought, not a quirk of our code. The honest reading isn't "trend-following is worthless." It's that its edge is modest, regime-dependent, and hard to capture with retail tools — and invisible if you reach for MACD.
A crisis hedge, oversold as a money machine.
Diversified trend-following is a real thing — near-zero correlation to stocks, and positive in the crises (2008, 2022) that sink a 60/40. But it is insurance, not alpha: modest at its academic best, negative with the popular MACD signal, and it makes you bleed for a decade at a time between payouts. Diversification couldn't save it, because you can't diversify an edge that isn't there — and across seven retail markets, it mostly wasn't. If you want the crisis hedge, size it like insurance and expect to pay premiums for years. If you want returns, the boring 60/40 that beat it on every horizon here is still sitting right there.
Weigh the strategy against the drawdown you'd actually sit through
Read first · TeardownMACD across market regimes — why one instrument was never a fair test, and what a regime-conditional view shows Tool
Position Size & Risk of Ruin — put a number on the decade-long drawdown a crisis hedge asks you to hold through Learn · Module 5
The validation gauntlet — benchmarks, out-of-sample regimes, and why "it hedges crises" still has to clear a boring baseline