MACD across market regimes: was the benchmark the bias?
Last time we tested the MACD crossover on the S&P 500 and it lost. But the S&P is a market that essentially only goes up — the one place a defensive rule can never win. So we ran the identical rule across regimes: the S&P split by trend, the Nikkei's lost decades, and a driftless currency. The verdict flips with the market — and testing only on markets that went up turns out to be a survivorship bias of its own.
Start here. This builds directly on our MACD teardown, which found the 12/26/9 crossover loses to buy-and-hold on the S&P 500. This piece asks the harder question that result raised: was that MACD's fault, or the market we tested it in?
1 / You can't out-defend a market that only goes up
Here's the objection I kept coming back to about my own MACD test. In a market that rises over time, being always 100% invested is the ceiling for any long-or-cash strategy — every day you spend in cash is a day of guaranteed underperformance. A signal like MACD-timing, which sits in cash roughly half the time, is structurally doomed to lag there. Judging a defensive tool in a relentless bull market is like judging an umbrella on a sunny day.
And it goes deeper. Reaching for the S&P 500 as "the benchmark" is itself a choice — of the single most successful equity market in modern history. That's survivorship bias one level up from the usual kind: other markets stagnated for decades, and some (Russia 1917, China 1949) went to zero for investors. The classic study of this is Dimson, Marsh & Staunton's Triumph of the Optimists. "Stocks always recover" is a statement about the markets that did. So let's stop testing MACD only where the answer is rigged, and separate the regimes.
2 / Split the same S&P test by regime
First, decompose the exact SPY test (1993–2026) by trend regime: tag every day by whether the S&P was above or below its own 200-day moving average (a standard, causal bull/bear filter), then measure both strategies within each regime.
| Annualized return within regime | Bull (S&P > 200-day MA) | Bear / sideways (< 200-day MA) |
|---|---|---|
| Share of all days | 77% | 23% |
| Buy & hold SPY | +11% | +9% |
| MACD-timed | +2% | +5% |
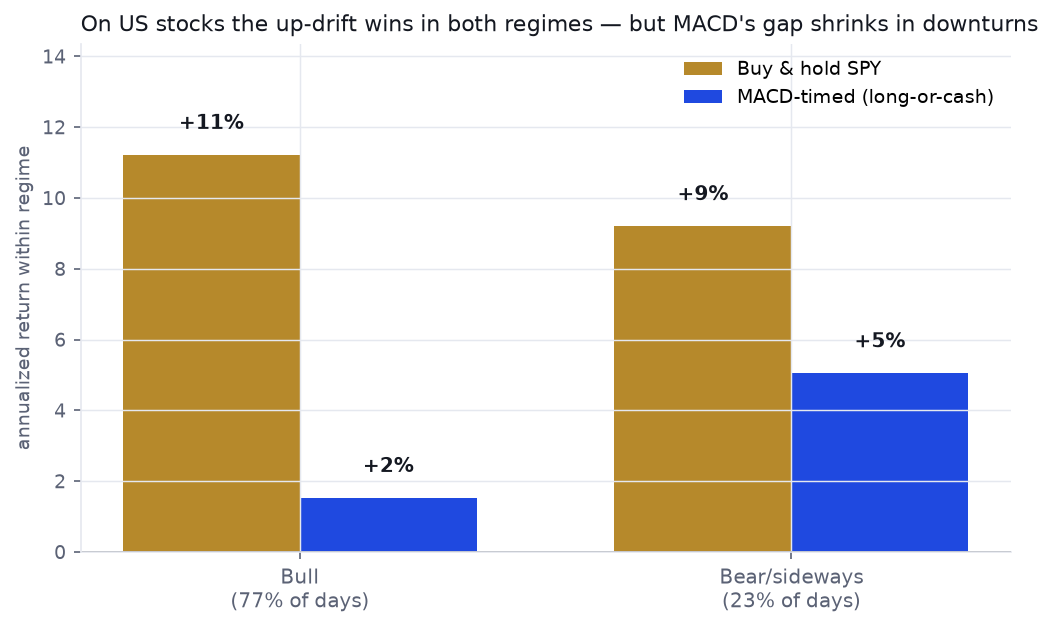
Two things. First, the deficit is concentrated in the bull market: MACD gives up nine points a year there, but only four when the S&P is below its average — exactly as the "umbrella on a sunny day" logic predicts. But second, the surprise: buy-and-hold is still positive and still ahead even in the "bear" bucket (+9% vs +5%). How? Because "below the 200-day average" is not the same as "falling." That bucket is where the violent first legs of the 2009 and 2020 recoveries happen — huge up-days that a lagging, defensive rule sits out. On US stocks the upward pull is so strong it beats defense even inside its own downturns. Which tells you the only way to see a defensive rule shine is to leave the market that keeps rescuing it.
3 / The same rule on a market that stayed down
So take the identical MACD-timing rule — no re-tuning — to the one major market that spent a generation going nowhere: Japan's Nikkei 225, from its 1989 bubble peak onward.
| Nikkei 225 | CAGR | Sharpe | Max drawdown |
|---|---|---|---|
| Buy & hold (1990–2026) | +1.2% | 0.17 | −82% |
| MACD-timed (1990–2026) | +0.8% | 0.13 | −60% |
| Buy & hold — the collapse, 1990–2012 | −5.6% | −0.12 | −82% |
| MACD-timed — the collapse, 1990–2012 | −1.1% | +0.01 | −60% |
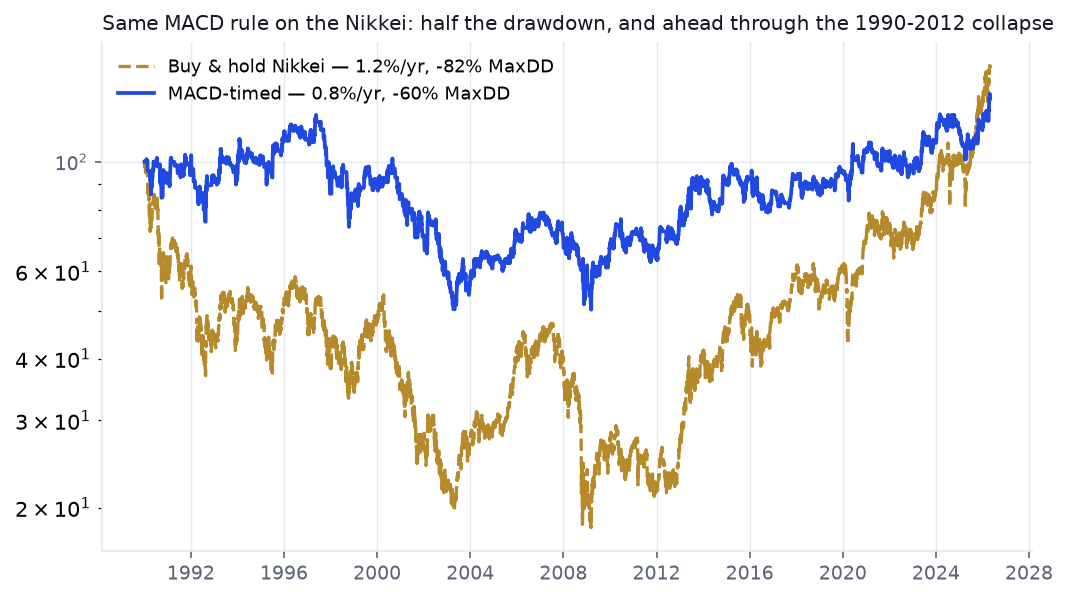
The rule that lost on the S&P now looks completely different. Through the great decline of 1990–2012, buy-and-hold bled −5.6% a year; MACD-timing, sitting out the persistent downtrends, lost only −1.1% — a positive Sharpe against a negative one — and it cut the maximum drawdown from a portfolio-ending −82% to −60%. Over the full window buy-and-hold edges back ahead on raw return (1.2% vs 0.8%), but only because it caught the post-2013 recovery. The defensive tool did exactly what defense is for — in the market where defense was actually needed. Nothing about MACD changed. The regime did.
4 / Strip out the drift entirely
One more test isolates the point. A currency pair like EURUSD has no structural upward drift — buy-and-hold returned roughly 0% a year over 2003–2026, just oscillating. And because there's no up-trend to be long-biased toward, we can let MACD trade the way trend-followers actually do: long and short.
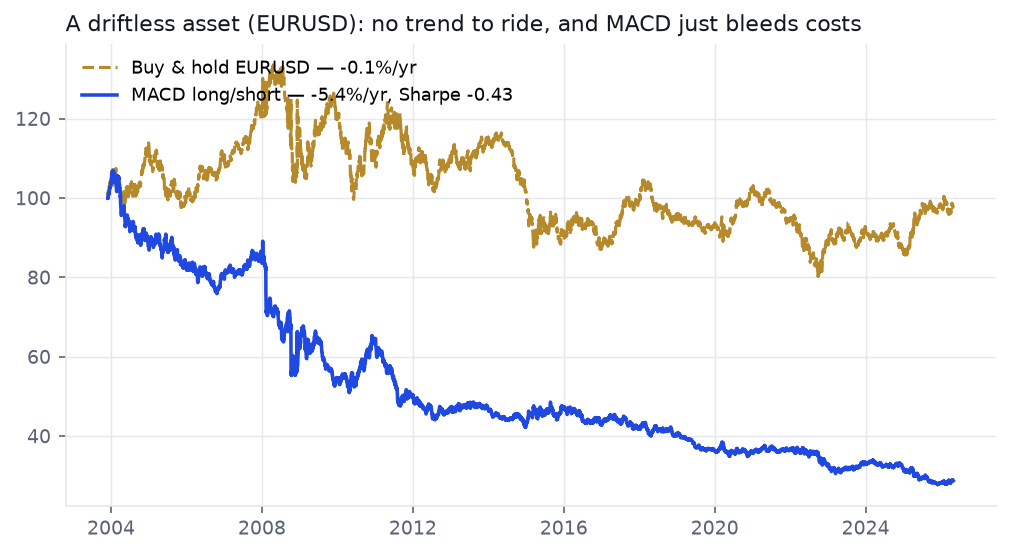
With the drift gone, so is the performance: MACD long/short lost −5.4% a year (Sharpe −0.43) after a trivial 2 bps in costs — death by a thousand whipsaws. This is the quiet truth behind the S&P result. MACD wasn't extracting a trend edge there; it was borrowing the market's upward drift and handing some of it back in lag and costs. Take away the drift and there's nothing underneath but the friction.
5 / Every indicator is a bet on a regime
If MACD is a bet on trends, its mirror image is a bet on ranges. Run our RSI(2) mean-reversion signal on the same S&P, split by the same regimes:
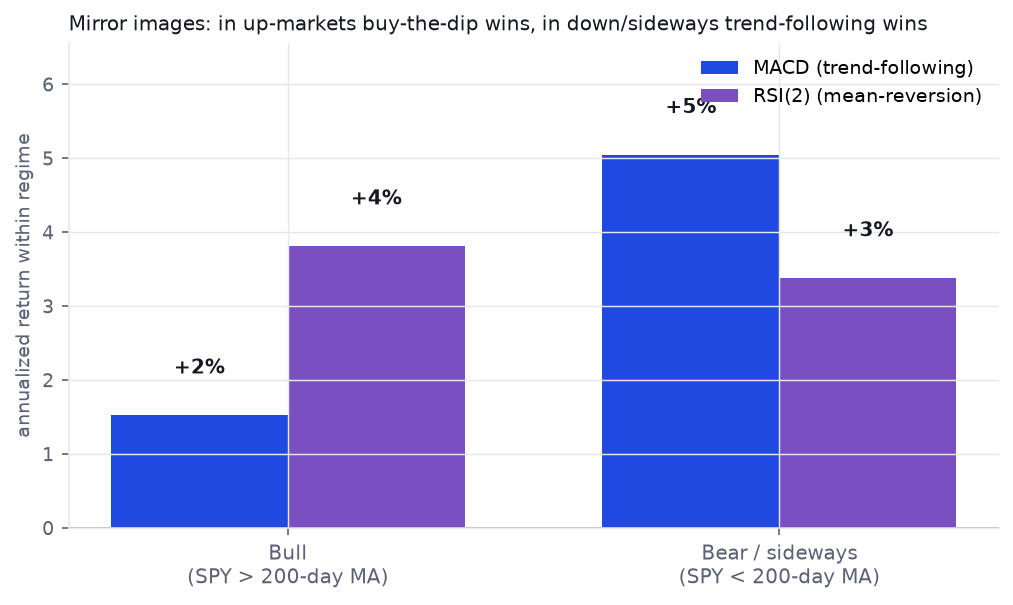
It's a clean inversion. When the market trends up, buying dips works because the dips get bought back. When it falls or chops, dip-buying catches knives and trend-following — staying with the move, or out of the way — pulls ahead. There is no context-free question "does MACD work?" or "does RSI(2) work?" There is only: which regime rewards this bet, and are you in that regime now? — a question a backtest of the past can never answer about the future.
Every backtest is a bet on the regime it ran in.
The MACD teardown wasn't wrong — on the S&P, MACD-timing really did lose. But that verdict belonged to the regime, not the indicator. The identical rule protected capital through the Nikkei's lost decades, and collapsed on a driftless currency where it had no drift to borrow. Three honest lessons outlast the strategy: a defensive tool can't be judged in a market that only rose; benchmarking against the S&P alone smuggles in a second layer of survivorship bias (you picked the winner after the fact); and an indicator's "edge" is often just the market's own behaviour, on loan. Match the tool to the regime — and never forget you can't know the next regime in advance.
Test your own strategy like the market has more than one mood
Read first · TeardownThe MACD crossover — the S&P test this piece re-opens, with the cost and overfitting analysis Learn · Module 4
Data traps & survivorship bias — why the market, the universe, and the period you pick are all silent thumbs on the scale Learn · Module 5
The validation gauntlet — out-of-sample testing across regimes, and why one good backtest proves almost nothing