Does the MACD crossover actually work?
MACD is probably the most popular indicator in all of trading. We tested the classic 12/26/9 crossover two honest ways — as a market-timer on the S&P 500, and as a signal across 1,500 stocks. It isn't a scam, and it even survives trading costs. But it's a lagging echo of price that a brainless half-cash portfolio beats — and its famous settings turn out to be arbitrary.
Credit. The Moving Average Convergence/Divergence indicator was developed by Gerald Appel in the late 1970s; the signal line and histogram are standard refinements. We reimplement the textbook indicator from scratch on our own data — no third-party code — and test the rule everyone repeats.
1 / What MACD is, and what it promises
MACD is three lines built entirely from a single price series:
- MACD line = 12-day EMA − 26-day EMA (how far the fast average sits above the slow one).
- Signal line = 9-day EMA of the MACD line (a smoothed version of the above).
- Histogram = MACD − Signal (the gap between them).
The rule the entire internet repeats: buy when the MACD line crosses above the signal line (the histogram turns positive), sell when it crosses back below. The pitch is that a crossover catches momentum turning — in early, out early. It sounds like a momentum radar. The problem is baked into the math: an EMA is a weighted average of prices that already happened, MACD is the difference of two of them, and the signal line smooths that difference again. It's a lag on a lag. Let's see what that does.
2 / Test one: can MACD time the market?
The simplest, most common use: time the index. Hold the S&P 500 (SPY) whenever MACD is above its signal line, sit in cash otherwise. We ran it over 2007–2026 — a window that deliberately includes 2008, 2020 and 2022, the exact crashes a timing signal is supposed to dodge. Costs of 10 bps a side.
| SPY, 2007–2026 | CAGR | Sharpe | Max drawdown |
|---|---|---|---|
| Just buy & hold SPY | 10.7% | 0.62 | −55% |
| Static 50/50 SPY/cash (no trading) | 5.7% | 0.62 | −31% |
| MACD-timed (long-or-cash) | 4.0% | 0.41 | −25% |
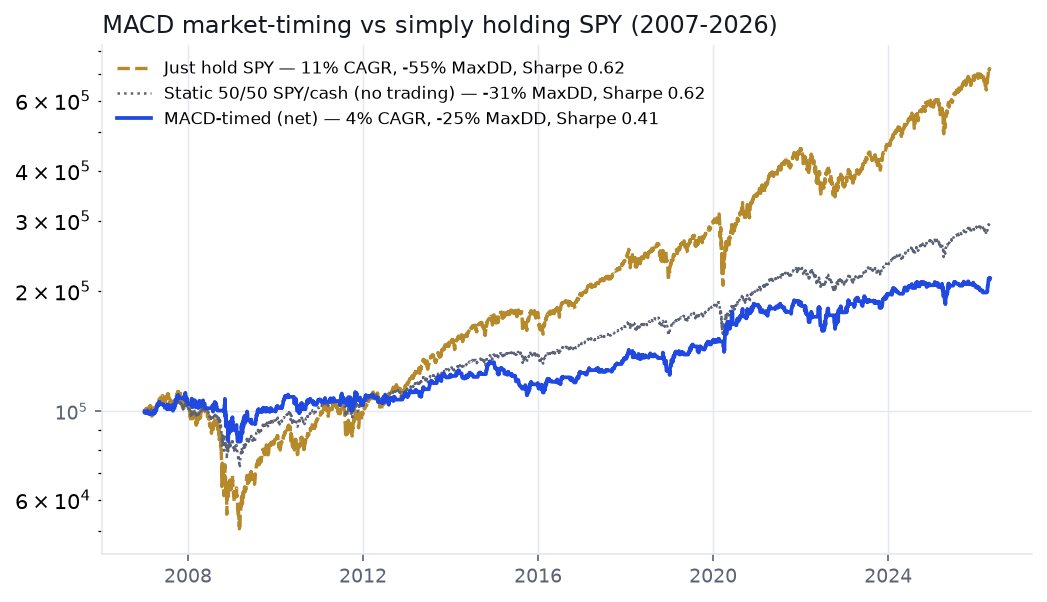
Give MACD its due: it did cut the drawdown, from −55% to −25%, by hiding in cash through the worst of 2008. That's real. But look at the price of that safety. Return collapsed from 10.7% to 4.0% a year, and the risk-adjusted Sharpe ratio got worse, not better — 0.41 versus 0.62. Now the knockout: a static 50/50 SPY/cash portfolio — literally half your money in the index, half in cash, rebalanced, zero trades ever — kept buy-and-hold's Sharpe (0.62) and cut the drawdown to −31%. It beats MACD-timing on return, on risk-adjusted return, at essentially the same drawdown, while MACD churned through 203 round-trips and sat out of a rising market 49% of the time. MACD didn't time anything. It just held a noisier, costlier, worse version of "own less."
3 / Why: it's lagging by construction
Why does a plausible momentum rule lose to doing nothing? Because a crossover can only fire after the move it's reacting to. Here is the 2020 crash and recovery, with every MACD exit and re-entry marked:
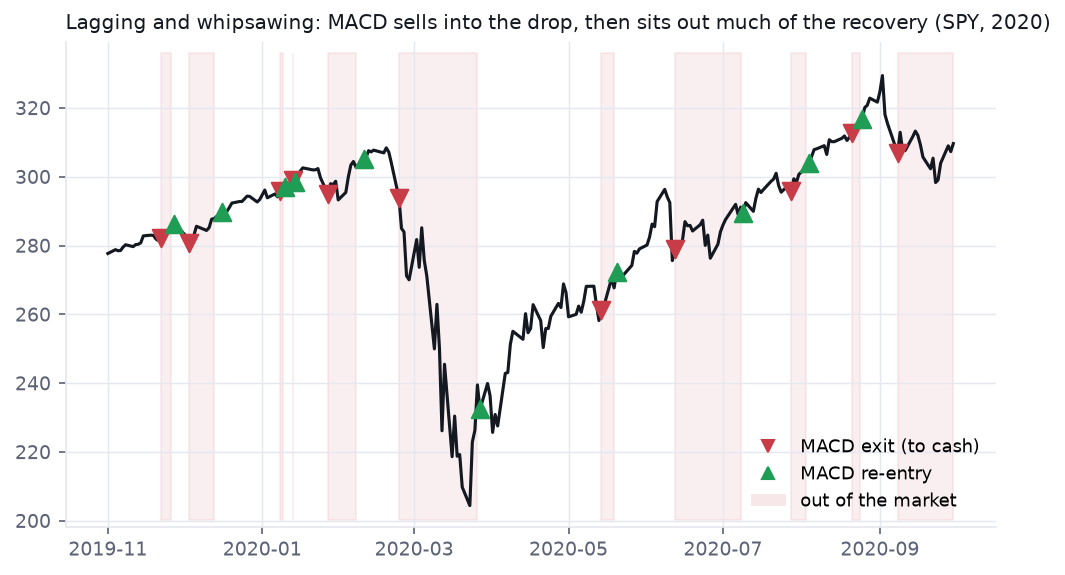
This is one episode, but it's the general property, not a fluke. MACD turns after price turns — that's what averaging does. It sold after the top had already rolled over, then, having gone to cash, missed big chunks of one of the fastest recoveries in history because the averages needed weeks to cross back up. In between, during the quiet uptrends, it flickered in and out — each little whipsaw a small, certain cost paid for a signal that was, by construction, always a step behind.
4 / Test two: MACD as a stock-picking signal
Maybe timing the whole index is too blunt. What about MACD as a systematic signal — go long any S&P 1500 stock on its bullish crossover, exit on the bearish one, across all 1,500 names at once (2015–2026, liquid names only)?
| S&P 1500, 2015–2026 · net 10 bps/side | CAGR | Sharpe | Win rate |
|---|---|---|---|
| MACD crossover (4,080 trades) | 7.9% | 0.48 | 34.9% |
| Just buy & hold SPY | 13.5% | 0.80 | — |
The win rate is only 35% — the opposite shape of a mean-reversion system. This is a trend signal: many small losers, a few big winners drag it into the black (profit factor 1.15). Before costs it posts a 0.68 Sharpe — but net of a realistic 10 bps a side it returned just 7.9% a year, while simply owning the index returned 13.5%. You took on 4,080 trades and single-stock risk to underperform SPY by more than five points a year.
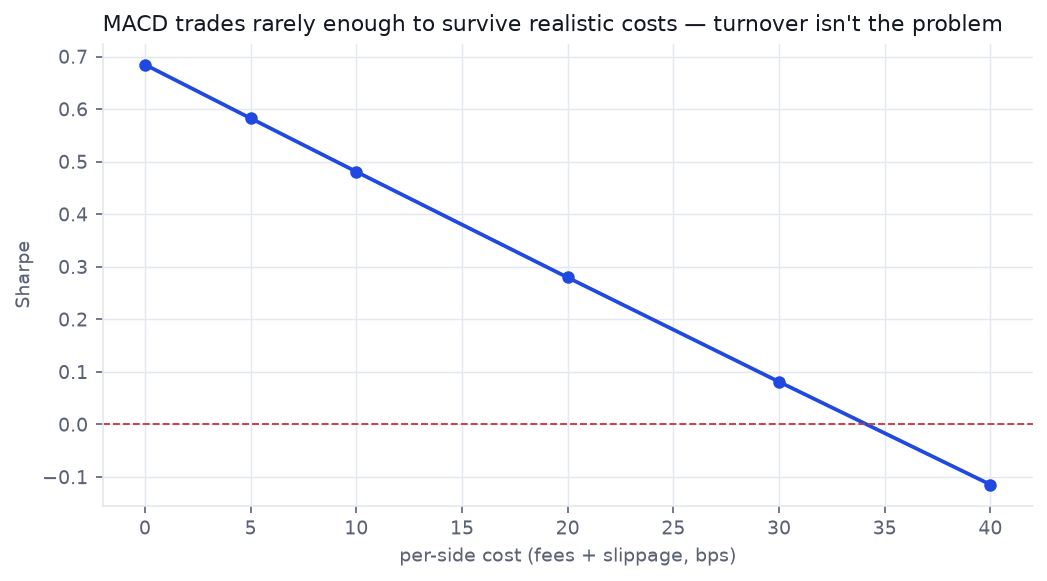
Here's a fair point in MACD's favour, and a useful contrast. Unlike Connors' RSI(2) mean-reversion — which fired 8,000+ times and died on costs around 10 bps — MACD trades rarely enough to survive realistic frictions, breaking even only around 30 bps a side. So costs are not its problem. Its problem is simpler and harder to fix: even for free, the signal doesn't beat owning the index.
5 / But aren't 12, 26 and 9 the wrong numbers?
The standard objection: the defaults are stale, so tune them. We let an optimizer (Optuna) search the fast, slow and signal periods on 2015–2020, then measured the winner on unseen 2021–2026 — and ran the result through the Deflated Sharpe Ratio, which discounts a backtest for how many combinations were tried.
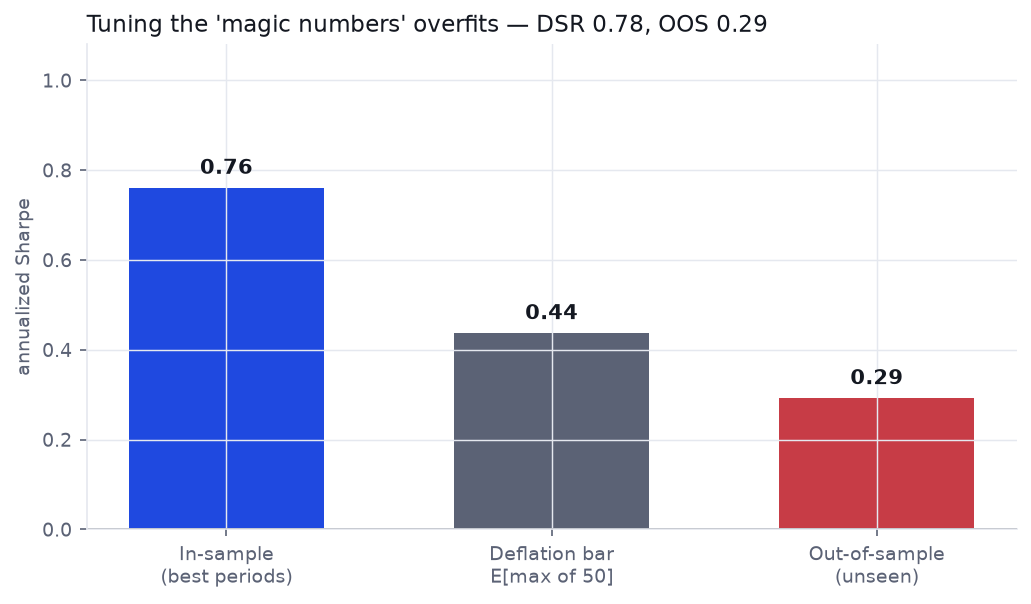
Two things fall out. First, the optimizer's "best" periods were 18 / 25 / 7 — nothing like 12/26/9, which tells you the famous numbers were never magic in the first place; they're one arbitrary triple among many. Second, the tuned Sharpe of 0.76 in-sample is an illusion: the Deflated Sharpe Ratio, accounting for the 50 combinations we tried, lands at just 0.78 — short of the 0.95 confidence you'd want — and out-of-sample the Sharpe collapsed to 0.29, below the deflation bar itself. Tuning the knobs didn't uncover an edge. It fit noise. (And this flatters MACD: our universe is today's S&P 1500 members, so survivorship bias already tilts the result optimistic.)
Two lagging averages can't add up to foresight.
MACD isn't a scam, and it isn't fragile to costs — as a timer it genuinely cut drawdown, and as a signal it survives realistic frictions. But in every honest framing it loses to the obvious lazy alternative: as a market-timer it's beaten by holding half cash and never trading; as a stock signal it's beaten by simply owning the index; and its celebrated 12/26/9 settings are arbitrary, so optimizing them just overfits. The through-line is mechanical, not mystical — a crossover of moving averages is a description of a move that already happened, not a prediction of the next one. Popularity was never the same thing as edge.
Test the next indicator you're told is "proven"
ToolNet-vs-Gross Backtest Costs — see how many basis points of friction your own strategy can absorb before the edge is gone Tool
Deflated Sharpe Ratio — the same deflation math we ran on the optimized MACD, for your own parameter searches Learn · Module 5
The validation gauntlet — out-of-sample testing, benchmarks, and why the settings that look best in a backtest rarely repeat