Does Connors' RSI(2) mean-reversion actually work?
It's one of the most-copied retail systems ever published, and it delivers exactly the 63% win rate it promises. We rebuilt it on 1,500 US stocks and ran it through honest validation. The win rate is real. The profit is not.
Credit. The RSI(2) mean-reversion system was popularised by Larry Connors and Cesar Alvarez in Short Term Trading Strategies That Work. We reimplement the published rules from scratch on our own data — no original code is used — and put them through the same honest validation as every teardown here.
1 / The strategy, and why everyone loves it
The rules are simple enough to fit on a napkin, which is half its appeal:
- Trend filter: only buy a stock trading above its 200-day moving average — mean-revert with the long-term trend, not against it.
- Entry: when the 2-period RSI drops below a low threshold (classically 5) — a sharp, short-term oversold dip.
- Exit: when the price closes back above its 5-day moving average — take the bounce and leave.
The other half of the appeal is the win rate. Buying deep short-term dips in uptrending stocks wins a lot of the time — and our rebuild confirms it, with a 63% win rate across 8,261 trades on the 2015–2026 S&P 1500. For most people that number ends the discussion. It shouldn't; it's where the discussion starts.
2 / A 63% win rate that loses money
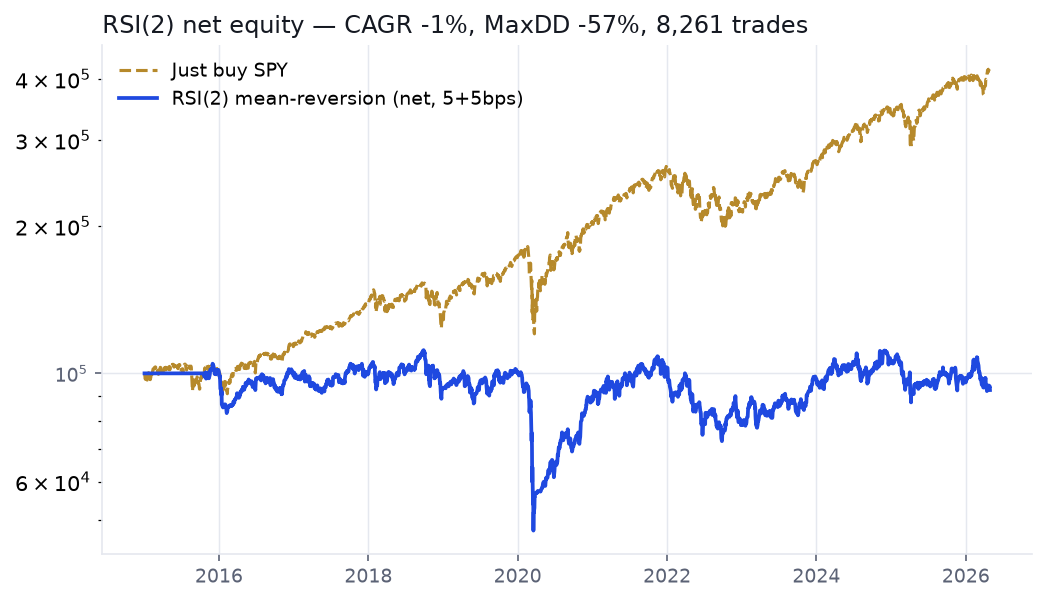
Here is the whole strategy, net of a realistic 10 bps per side in costs (commission plus slippage), against the laziest possible benchmark — buying and holding the index.
| RSI(2), net of 10 bps/side (2015–2026) | Value |
|---|---|
| Win rate | 63.1% |
| Profit factor | 0.99 |
| CAGR | −0.7% |
| Max drawdown | −57.3% |
| Trades | 8,261 |
| Just buy & hold SPY | +13.5% CAGR · −34% MaxDD |
Sixty-three percent of trades make money and the strategy still ends underwater. That's the trap of the win rate: it says nothing about the size of the losers. Mean-reversion wins small and often, then occasionally rides a dip all the way down — most brutally in March 2020, when "buy the oversold stock in an uptrend" meant catching a falling knife across the whole market at once, for a −57% drawdown. A profit factor of 0.99 tells the honest story: for every dollar won, a dollar and a cent is lost.
3 / It lives and dies on costs
Notice the trade count: 8,261. A strategy that trades that often pays the spread, commission and slippage that often — and that bill is where the edge goes to die.
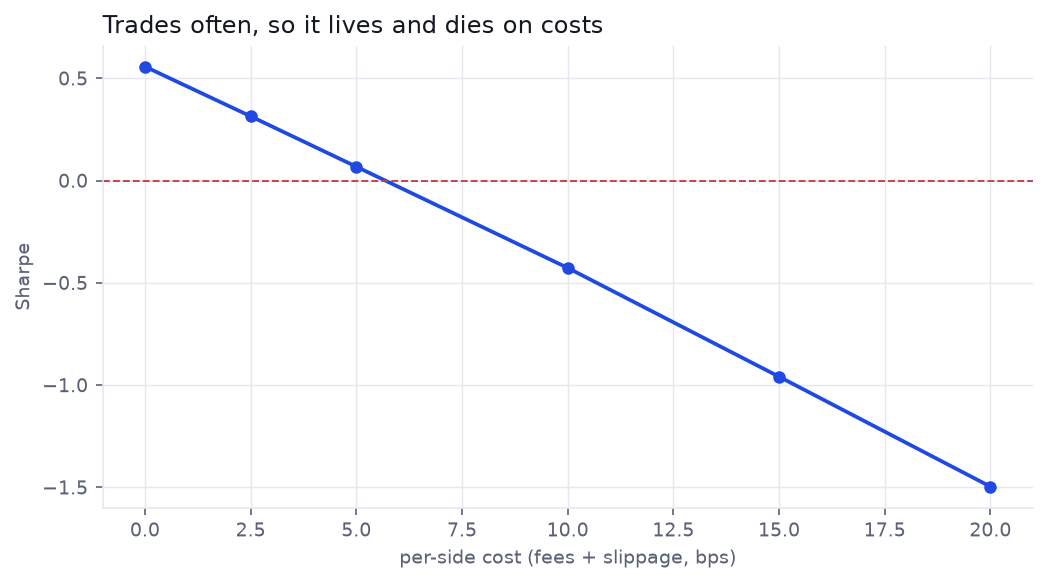
At zero cost the strategy looks respectable — a 0.56 Sharpe and a 9.6% CAGR. That is the number a careless backtest reports, and it's the number in most of the blog posts. But break-even sits at only about 10 basis points per side — right about where realistic retail costs land. A little below that and you profit; at typical costs you're already at the line; and the decline is steep from there — by 20 bps a side it's a −0.43 Sharpe bleeding roughly 10% a year, and 40 bps is a −1.5 Sharpe disaster. High-turnover mean-reversion is the purest example there is of a strategy where gross and net are different universes. It's exactly what our net-vs-gross cost calculator is built to expose.
4 / Optimizing it doesn't rescue it
Maybe the classic thresholds are just unlucky. We handed three parameters — the RSI threshold, the trend filter length, and position size — to Optuna, let it search 60 configurations to maximise the in-sample (2015–2020) Sharpe net of costs, then checked the winner on unseen 2021–2026 data and deflated it for the search.
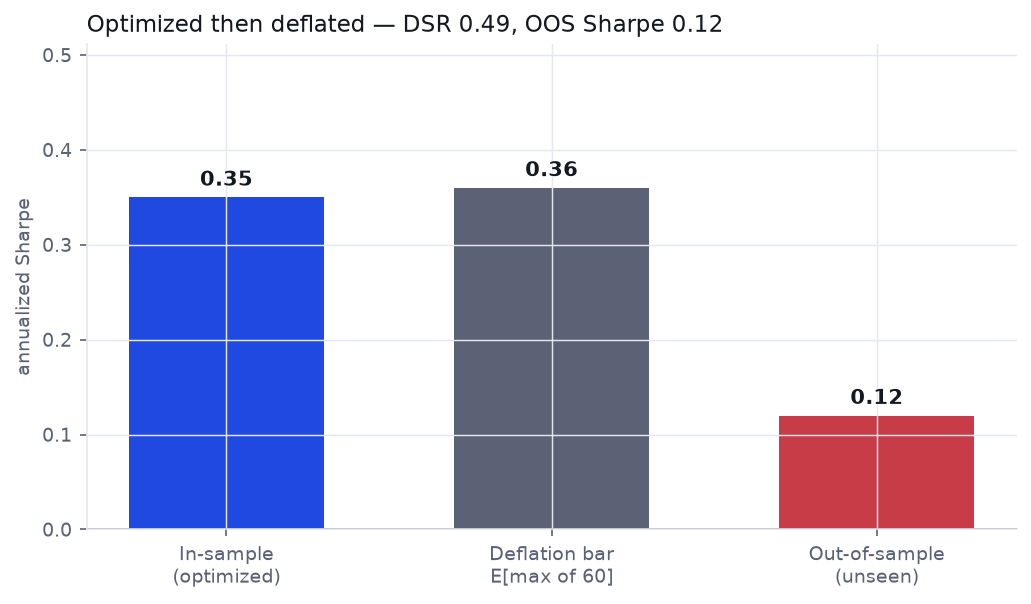
The tuned in-sample Sharpe is a weak 0.35, the Deflated Sharpe Ratio is 0.49 (a coin flip, far from the ~0.95 you'd want), and out-of-sample it drops to 0.12 with a −42% drawdown. There was never much to optimize: even the best net-of-cost version of RSI(2) is statistically indistinguishable from noise once you account for the search — the trap our overfitting guide is about.
5 / And we're still flattering it
Survivorship bias, and it's worse here than usual. Our universe is the current S&P 1500. A dip-buying strategy is the single worst case for that bias: it deliberately buys stocks that just fell hard — and the ones that kept falling to zero (the failed dips) have been deleted from the list. The real strategy would have bought some of those knives and never let go. Every number above is therefore an optimistic upper bound; the honest result is worse still.
A real tendency, an untradeable strategy.
RSI(2) mean-reversion isn't a scam — there is a genuine short-term bounce, and the 63% win rate is real. But the edge is smaller than simply holding the index even before costs, it's entirely eaten by the friction of 8,000 trades, it can't survive its own optimization or an out-of-sample year, and it's flattered by survivorship. The lasting lesson isn't "mean-reversion doesn't work" — it's that win rate is the most misleading number in trading, and that turnover and costs decide the fate of a system long before the signal does.
Check any strategy the same way
ToolNet-vs-Gross Costs — turn a gross curve into a net one and find the break-even that killed this one Tool
Deflated Sharpe Ratio — discount a Sharpe for the number of variants you tried More teardowns
See the same honest validation run on other published strategies