Statistical arbitrage done right: can a cointegrated pair clear the bar?
A triangular-arbitrage system was broken; EURUSD/GBPUSD weren't cointegrated. So does pairs trading ever work? We screened eight candidate pairs, deep-dived the one textbook pair that passes, and held it to a serious acceptance bar. Done right, the edge is real — but thin.
The method. An Engle-Granger cointegration screen across eight candidate pairs; then, on the winner, an in-sample hedge ratio, a rolling z-score, Optuna over the lookback and thresholds, a 40% out-of-sample hold-out, a modeled per-leg cost, and a Deflated Sharpe Ratio for the 300 trials. Finally, the result is judged against a real acceptance bar — the kind a desk sets before funding a strategy.
First, the screen: most "obvious" pairs aren't cointegrated
A pairs trade needs cointegration — a spread that reliably returns to a mean — not mere correlation. So we tested eight pairs people reach for. Only three pass the gate.
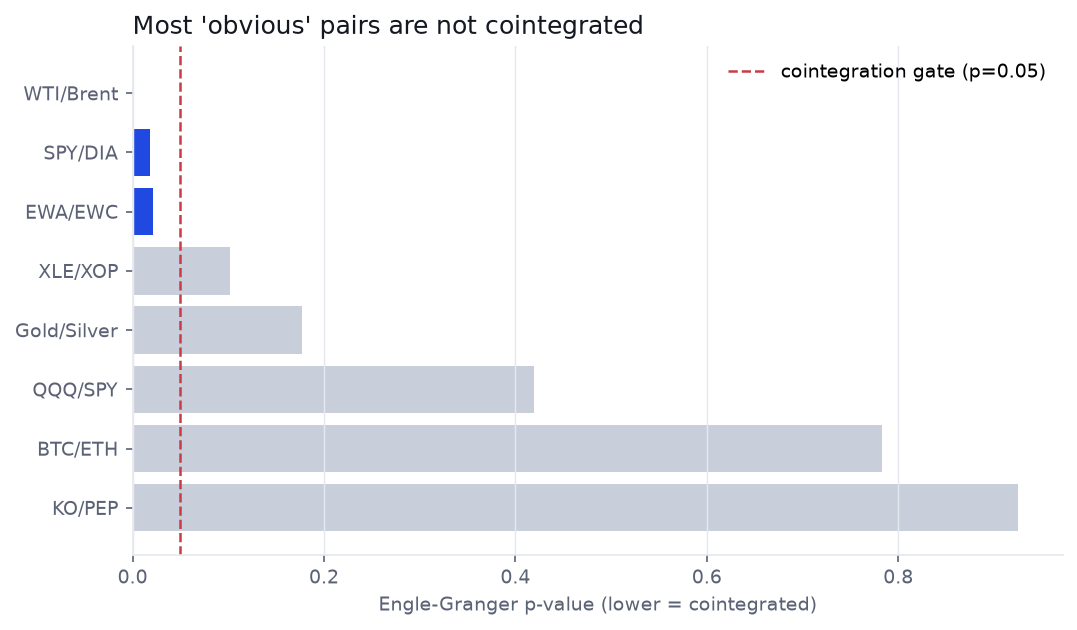
That is the previous teardown's lesson at scale: Coke and Pepsi move together, but their spread wanders off and never comes back, so there is nothing to trade. We take the cleanest survivor forward — EWA/EWC, the Australia and Canada country ETFs, two commodity-driven economies and a classic pairs candidate.
EWA/EWC: a spread that actually reverts
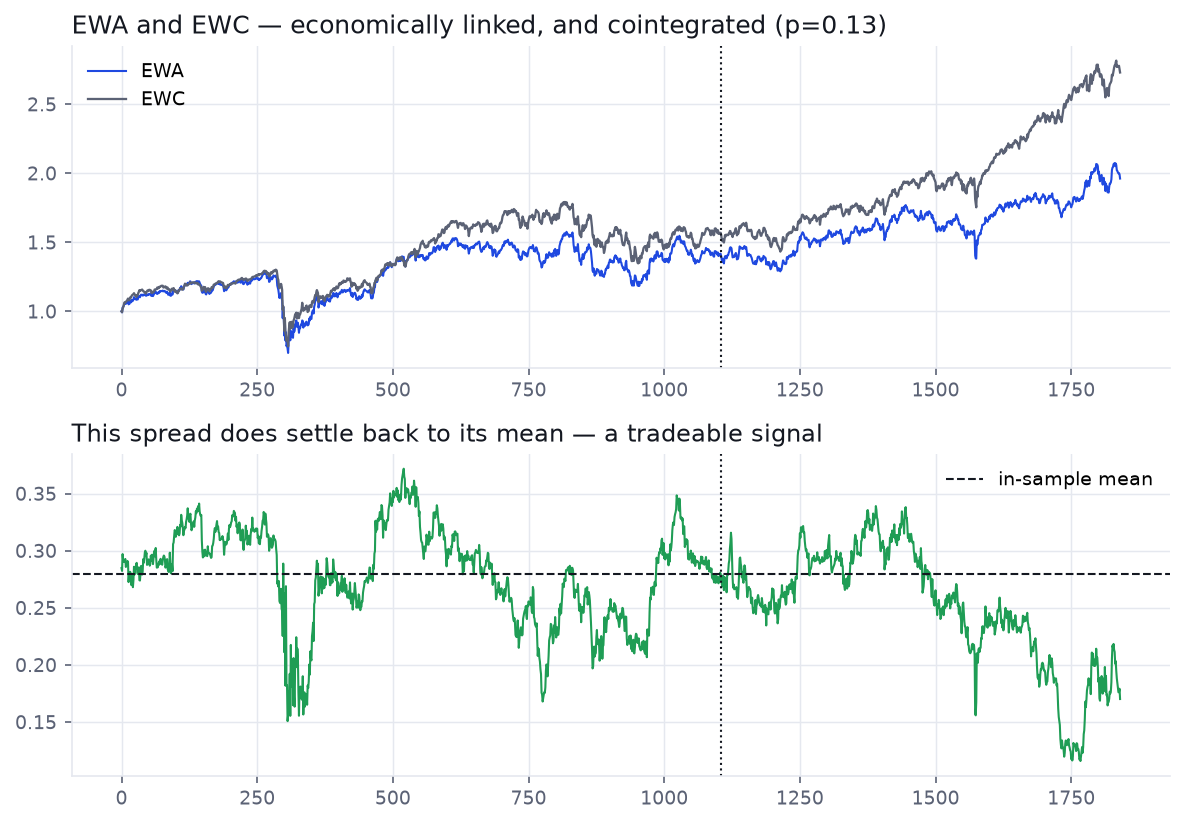
So the raw material is there. We fit the hedge ratio in-sample, z-score the spread, and let Optuna search the lookback and the entry/exit thresholds — then we look at the half we never touched.
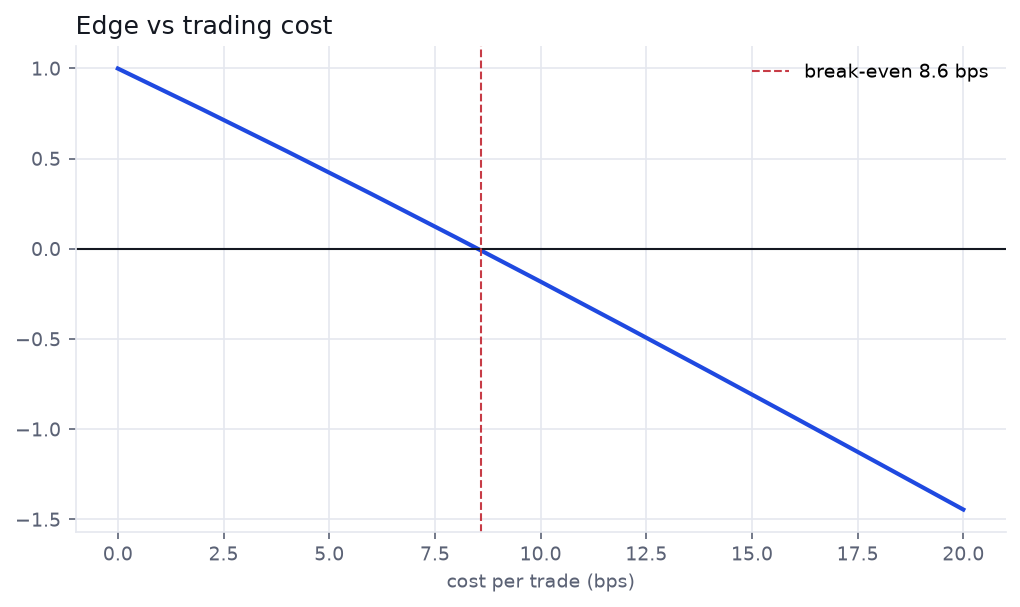
The out-of-sample edge is real
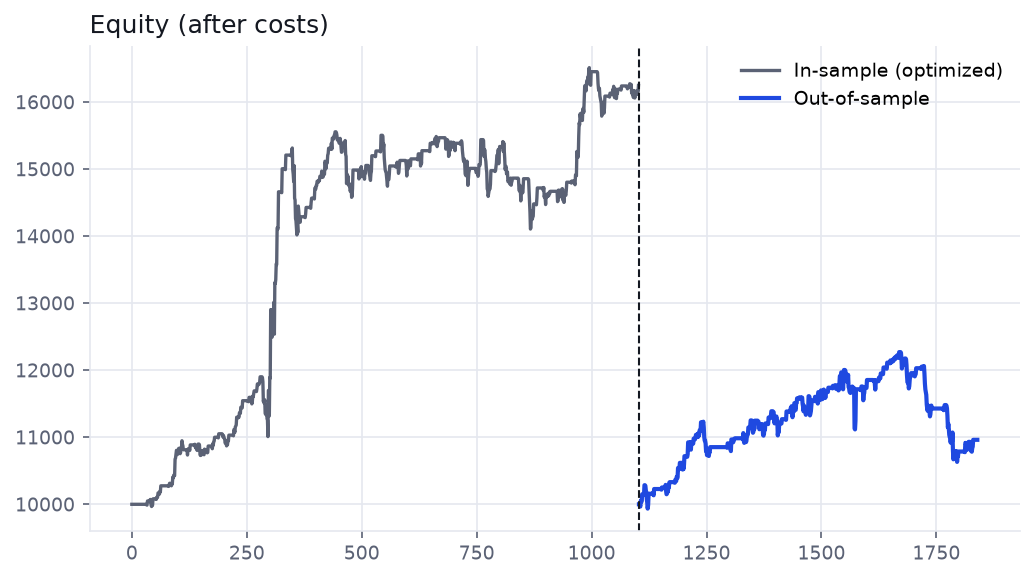
This is genuinely different from the two failures before it. The strategy is cointegration-grounded, the out-of-sample return is positive after a real cost, and there is a comfortable break-even cushion. If the question is "can honest pairs trading make money," the answer here is a cautious yes.
But does it clear the bar?
Making money and being fundable are different tests. Hold the result to a serious acceptance bar — OOS Sharpe ≥ 1.2, max drawdown ≤ 12%, profit factor ≥ 1.4, and still profitable at double the assumed cost:
| Criterion | Result | Verdict |
|---|---|---|
| OOS Sharpe ≥ 1.2 | 0.42 | fail |
| OOS max drawdown ≤ 12% | −13.3% | fail |
| OOS profit factor ≥ 1.4 | 1.11 | fail |
| Profit factor ≥ 1.15 at 2× cost | <1.15 | fail |
| Deflated Sharpe (300 trials) | 0.16 | weak |
It misses every line. The in-sample Sharpe of 1.08 more than halves to 0.42 out-of-sample, the drawdown breaches the limit, and — the number that matters most — the Deflated Sharpe is 0.16. After charging the strategy for the 300 parameter sets we tried, the headline collapses: there is a positive edge, but it is not robust enough to bet the proposal's KPIs on.
Verdict
A real edge — but a thin one.
This is the series' first genuine, cost-surviving out-of-sample edge, and it earns that by starting from a cointegrated pair instead of a merely correlated one. But it is modest: it fails a serious acceptance bar on every line, and the Deflated Sharpe (0.16) says a single pair tuned over 300 trials is not something to size up. Cointegration is necessary. It is not sufficient.
How a thin edge becomes a tradeable one
The fix is not a better single pair; it is discipline and breadth:
- A portfolio of pairs, not one. A 0.4-Sharpe edge on one pair is noise; twenty weakly-correlated 0.4-Sharpe edges can be a real book. Stat-arb is a breadth game.
- Re-screen and re-fit on a schedule. Cointegration is time-varying (we saw EWA/EWC drift from p=0.13 to 0.02). Walk-forward, and drop pairs whose spread stops reverting.
- Guard the structure. A half-life-based time-stop, a robust z-score, and a correlation gate that blocks entries when the relationship is breaking down.
- Deflate, always. Every pair and every parameter you try lowers the bar a real edge must clear. Put a number on it.
Check the math yourself
ToolDeflated Sharpe Ratio — what does a 300-trial backtest's headline actually survive? Tool
Position Size & Risk of Ruin — size a thin edge so a −13% drawdown doesn't end you