Does EURUSD/GBPUSD pairs trading actually work?
Last time, a triangular-arbitrage system fell apart. Its legitimate cousin is statistical arbitrage — trade the mean-reverting spread between two cointegrated instruments. EURUSD and GBPUSD move together almost in lockstep. So does pairs trading them work? We ran it properly. Correlation, it turns out, is not cointegration.
The method. Hedge ratio from an in-sample regression, spread = log(EURUSD) − β·log(GBPUSD), a rolling z-score for the signal, and Optuna over the lookback and the entry/exit thresholds. We hold out the last 40% for out-of-sample, model a per-leg cost, and deflate the result with the Deflated Sharpe Ratio for the 300 trials we ran. Two years of hourly bars (≈12,400).
Correlation is not cointegration
EURUSD and GBPUSD are both "the dollar," so they move together — the hourly return correlation is 0.79. That is what makes people reach for a pairs trade. But a pairs trade does not need correlation; it needs cointegration — a spread that wanders off and is reliably pulled back to a stable mean. Those are not the same thing.
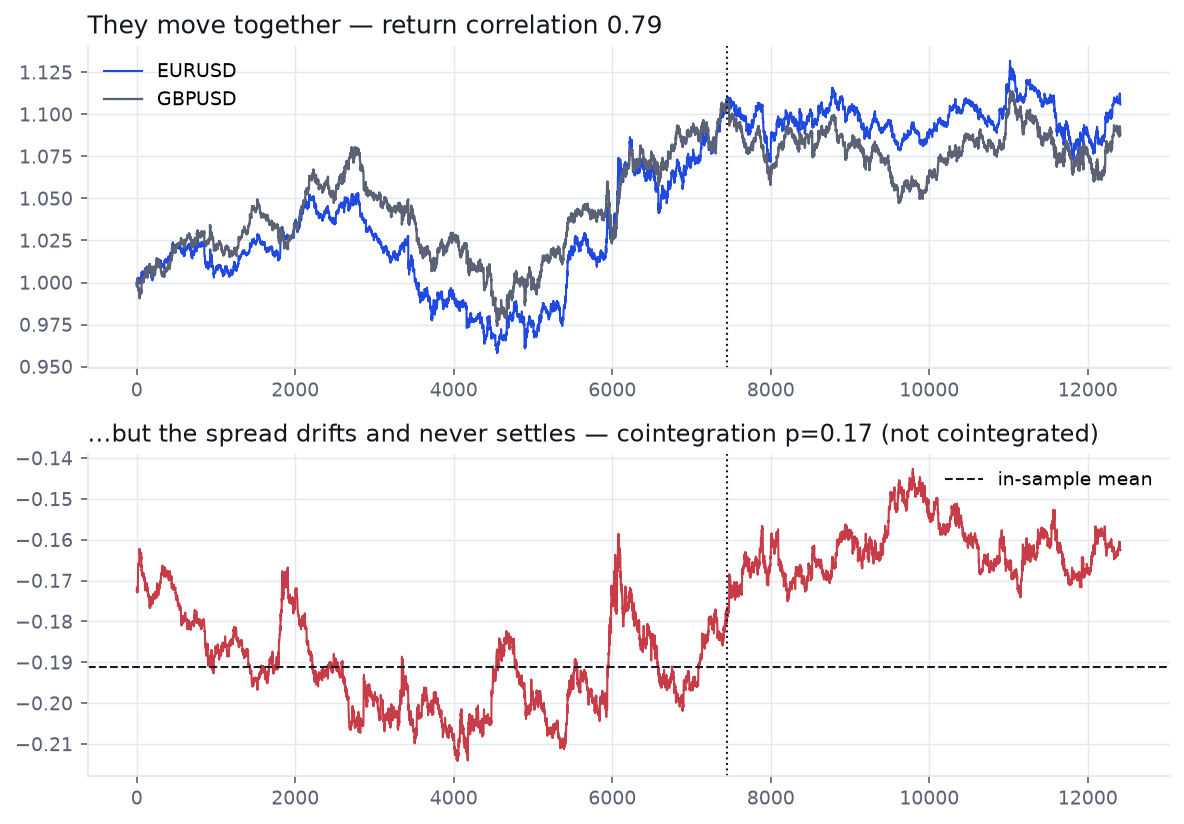
The spread spends 2024 below its in-sample mean and 2025–26 above it. There is no stable level to revert to, which means the central assumption of the trade is missing from the start. The cointegration test is the gate, and this pair does not pass it.
The in-sample mirage
Suppose we ignore the test and optimize anyway — 300 Optuna trials over the lookback and z-score thresholds, scored on in-sample Sharpe. The best run produces a tempting, rising in-sample curve. Then the out-of-sample half begins.
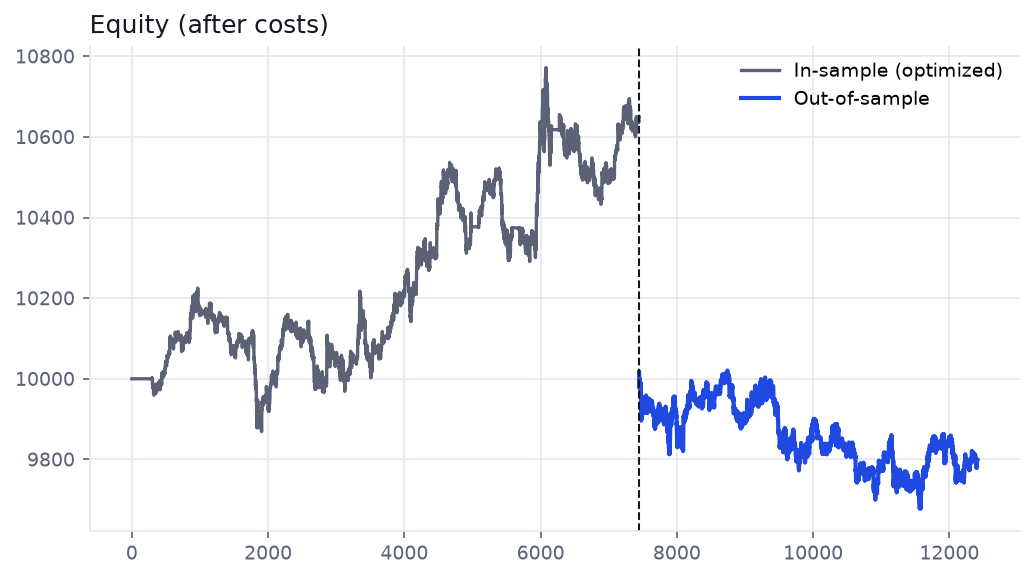
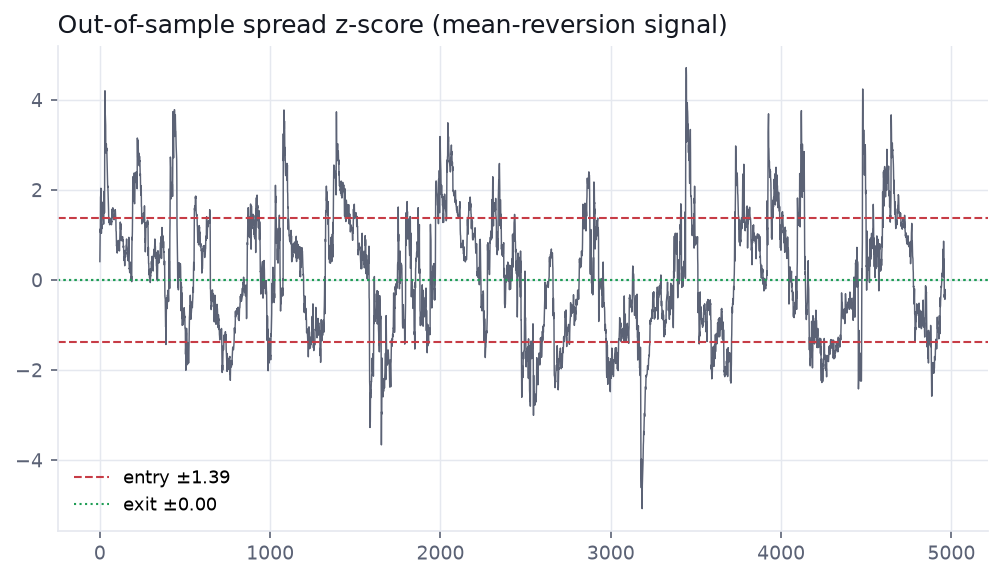
This is the shape of overfitting, not edge. The in-sample Sharpe is about 0.01 — the gain is noise dressed as a trend. The signal does fire: the z-score crosses the bands often enough. It just does not pay, because the spread overshoots and wanders instead of snapping back.
The Deflated Sharpe puts a number on it
Three hundred parameter trials is three hundred chances to fit noise. The Deflated Sharpe Ratio corrects the headline for exactly that. Feeding the trial count back in:
| Metric | In-sample | Out-of-sample |
|---|---|---|
| Sharpe (after cost) | 0.01 | −0.01 |
| Deflated Sharpe (300 trials) | — | 0.01 |
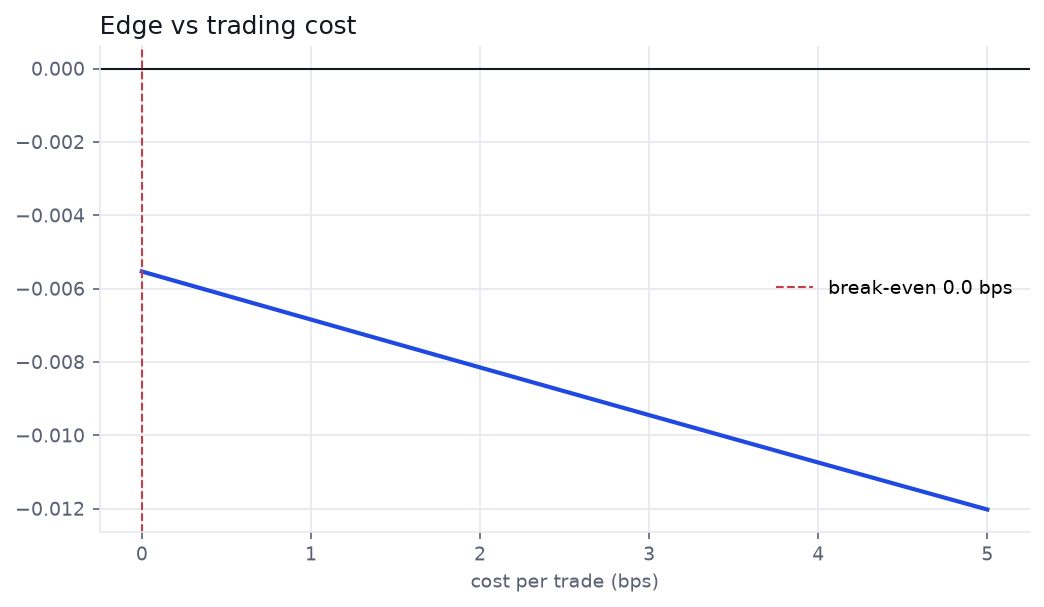
| Return | +7% | −2.2% |
| Break-even cost | — | 0.0 bps |
A Deflated Sharpe of 0.01 says there was essentially no real edge to find; the in-sample curve is the luckiest of 300 draws from noise. And the break-even cost is zero — the strategy fails to clear even a frictionless market, let alone real spreads.
Verdict
No — and the cointegration test said so up front.
EURUSD and GBPUSD are correlated but not cointegrated, so their spread has no stable mean to trade. The optimized in-sample curve is an overfit mirage (Deflated Sharpe ≈ 0), and out-of-sample the edge is negative even before costs.
The method is right; the pair is wrong
Statistical arbitrage is real and tradeable — but only on instruments that are genuinely cointegrated, not merely correlated. Better hunting grounds: two stocks in the same sector with a shared driver, the front and back contracts of the same future, or a hard-pegged crypto pair. The discipline that matters is the order of operations:
- Test for cointegration first. If the spread is not stationary, stop — no amount of threshold tuning will save it.
- Hold out time, not rows. A spread that mean-reverts in 2024 can drift all of 2025.
- Deflate for the search. Every parameter you try lowers the bar a real edge must clear. Compute it.
Check the math yourself
ToolDeflated Sharpe Ratio — what does your backtest's headline survive after 300 trials? Guide
Backtest overfitting — why the best in-sample curve is usually the luckiest one