Triangular arbitrage in MT5 + Python: does it actually work?
A popular MetaTrader 5 system generates a thousand "synthetic" cross rates and ships a rising backtest curve. We rebuilt it properly on real tick data. The signal compares the wrong instruments, the backtest manufactures its profit, and the genuine edge is below cost.
What this is. A clean-room reimplementation of the published idea for analysis and commentary — no original code is reproduced. The original author is credited and linked above. Validation uses real EURUSD tick data (9.5M ticks, 2024) and ~2 years of hourly EURUSD/GBPUSD bars.
The claim
The system pulls bid/ask from 25 currency pairs in MetaTrader 5, builds hundreds of "synthetic" prices by dividing one pair by another, and flags an opportunity whenever a real price diverges from its synthetic by more than 0.00008 (0.8 pips). It then fires market orders with a fixed take-profit and stop-loss. In spirit this is triangular arbitrage: when a cross rate disagrees with the rate implied by two other pairs, trade the gap. The published backtest shows a smoothly rising equity curve. So — is the edge real?
Crack one: it compares the wrong things
The signal is spread = real_pair.bid − synthetic_price. But the synthetic is built from a different pair. The synthetic made from EURUSD and GBPUSD is EURUSD / GBPUSD ≈ EUR/GBP ≈ 0.85 — and the code subtracts it from the real EURUSD ≈ 1.08. You are comparing EUR/GBP to EUR/USD: two different instruments about 0.23 apart. A 0.8-pip threshold against a 0.23 gap is meaningless — effectively every bar "triggers."
It is also dimensionally inconsistent. EURUSD/GBPUSD happens to be a valid cross (the USD cancels). But the same blind division applied to, say, AUDUSD/USDCHF gives AUD·CHF/USD² — not the price of anything tradeable. A real triangular signal compares a synthetic cross against the matching real cross (synthetic EUR/GBP vs the actual EUR/GBP quote), not against an unrelated pair.
Crack two: the backtest manufactures its profit
This is the part that produces the pretty equity curve. In the backtest a winning trade is booked as take_profit × 800 and a loser as −stop_loss × 400 — a fixed 4:1 payoff hard-coded into the P&L, decoupled from the actual price move. But the barriers are 80 pips (TP) and 40 pips (SL): a real 2:1 ratio. The accounting pays winners as if they were 4:1.
Double the reward:risk and almost anything "profits." To prove the curve is an accounting artifact, we fed the same engine random coin-flip signals. With an 80/40 barrier on a roughly driftless market the win rate is about one in three — and the fabricated 4:1 books a steady gain, while an honest tally of the very same trades (the actual 80/40 pips at the system's own 0.5-lot size) loses half the account.
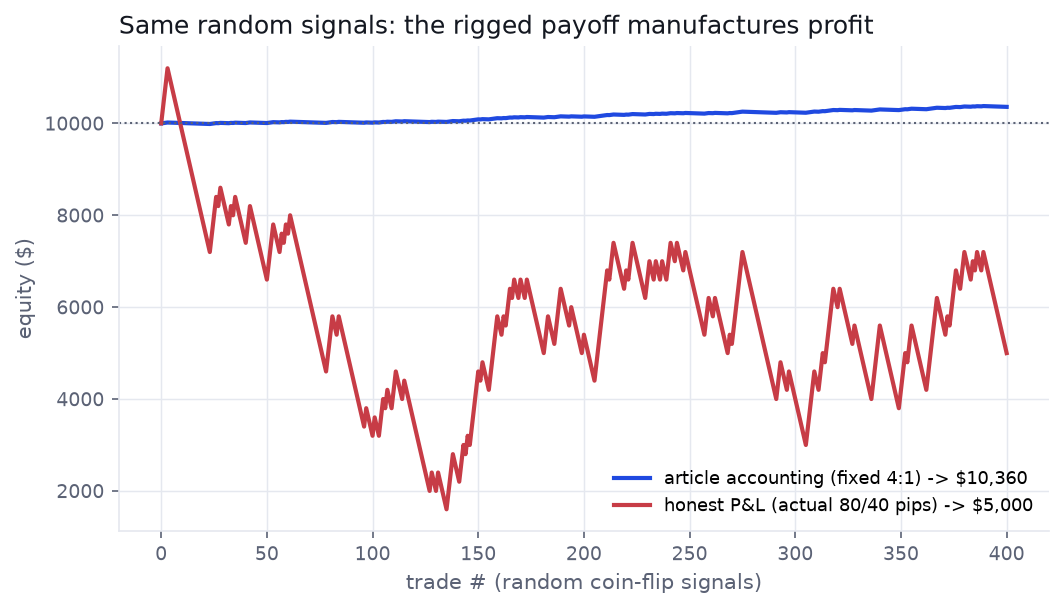
The equity curve never measured a signal. It measured the payoff multipliers.
The cost wall
Suppose we fix the signal. To capture a triangular dislocation you must trade all three legs, crossing three bid/ask spreads. How big is that wall? From the EURUSD tick data the raw interbank spread is a tight 0.20 pips at the median — but it widens sharply into the 21:00–22:00 UTC rollover, and a retail broker stacks its markup on top of all three legs.
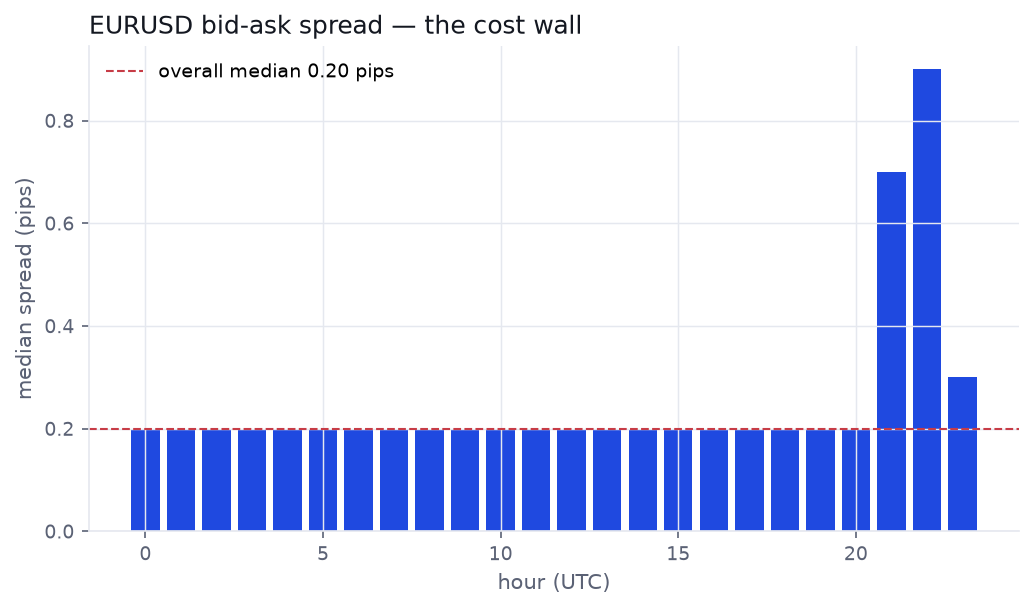
Three legs, round trip, at realistic retail spreads lands around 3–4 pips. That is the bar any real dislocation has to clear.
Done right: the edge is below the wall
We computed the synthetic cross the correct way — EUR/GBP = EURUSD ÷ GBPUSD, dimensionally valid — and compared it to the real EURGBP over ~2 years of hourly bars. The two track within about 2 pips at the 95th percentile. Only 1.2% of bars deviate by more than a realistic ~4-pip retail cost — and that thin tail is dominated by cross-feed timing noise (two different data sources sampled a hair apart), not arbitrage.
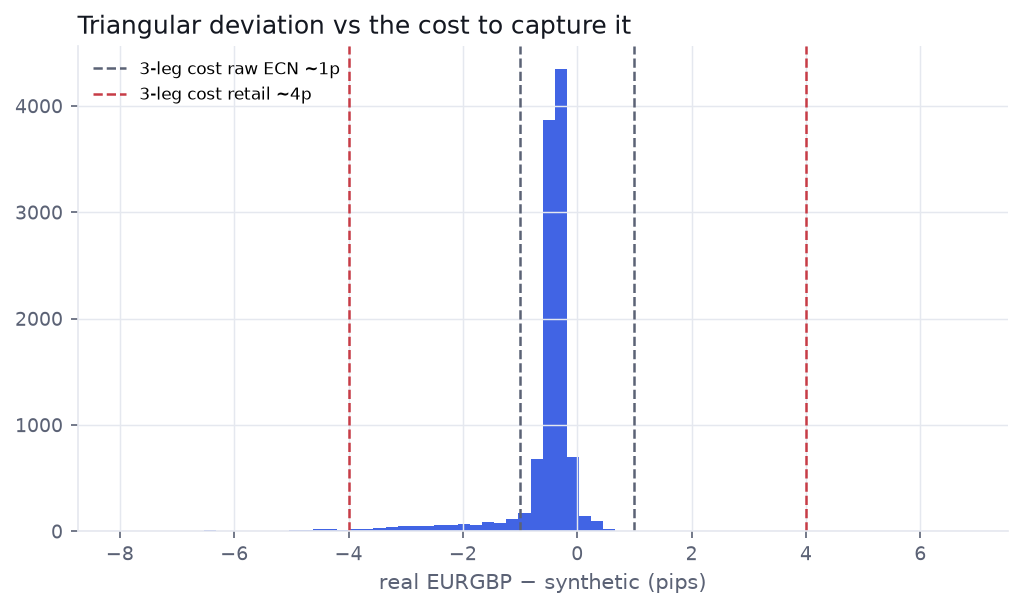
There is a deeper problem the bar chart hides: genuine triangular dislocations live at the tick level and close in milliseconds, inside the bid/ask. A retail Python loop polling MT5 every five minutes — as the system does — arrives long after the gap is gone. You cannot backtest this on bars, and you cannot trade it from a home connection.
Verdict
No. There is no exploitable edge.
The signal compares incompatible instruments; the backtest's profit is an accounting artifact; and the correctly-specified opportunity is smaller than the cost to capture it and far too fast for retail to reach.
What's actually good
- The plumbing. The MT5↔Python loop — pull ticks, compute in pandas, route orders — is a clean, reusable template, and a fine way to learn the API.
- The instinct. Trading price relationships between correlated instruments is sound. It is just mis-specified here as a pure-arbitrage signal it can never be.
What would have to change for it to mean anything
- Compare a synthetic cross to its matching real cross, not to an unrelated pair.
- Account P&L from the actual price path, not fixed multipliers — and model the three-leg spread.
- Accept that true triangular arbitrage is a latency game retail cannot win, and reach instead for a relationship that lives at bar resolution.
The legitimate cousin: statistical arbitrage
The same instinct, done in a way you can actually validate: trade the cointegration between two correlated pairs (EURUSD and GBPUSD) through their z-scored spread — with proper out-of-sample testing and a Deflated Sharpe Ratio that accounts for every parameter we try. Does that survive costs? We tested it →
Check the math yourself
ToolNet-vs-Gross Cost Calculator — find the break-even cost for any edge Tool
Deflated Sharpe Ratio — how many trials does your backtest's headline survive?