Dual Momentum out of sample: does GEM still beat buy-and-hold?
Gary Antonacci's Dual Momentum is one of the most-cited tactical strategies of the last decade, sold on a backtest with high returns and roughly half the drawdown of stocks. We ran it on the years since the book came out — a genuine out-of-sample test. It's no scam. But the magic mostly doesn't repeat.
Credit. Global Equities Momentum (GEM) is the flagship model from Gary Antonacci's Dual Momentum Investing (2014). We reimplement the published rules from scratch on our own data — no original code — using standard ETF proxies (SPY, VEU, AGG, BIL) for total return.
1 / The strategy, and its promise
GEM is elegant. Once a month, it looks at trailing 12-month returns and stacks two ideas:
- Absolute momentum (the risk switch): if US stocks' 12-month return beat Treasury bills, stay in equities; if not, move entirely to aggregate bonds. This is what dodges bear markets.
- Relative momentum (the picker): when in equities, hold whichever of US or non-US stocks has the stronger 12-month return.
The pitch is seductive: over a multi-decade backtest, GEM matched or beat stocks while cutting the worst drawdown roughly in half. Simple, monthly, mechanical, and it "sits out" crashes. So does it hold up?
2 / The full picture: real drawdown protection, thinner returns
Over the full window our ETF proxies allow (2008–2026, which includes the crisis GEM was built for):
| 2008–2026 | CAGR | Sharpe | Max drawdown |
|---|---|---|---|
| Dual Momentum (GEM) | 9.1% | 0.74 | −20% |
| Just buy & hold SPY | 11.6% | 0.77 | −42% |
| Static 60/40 (SPY/AGG) | 8.3% | 0.84 | −27% |
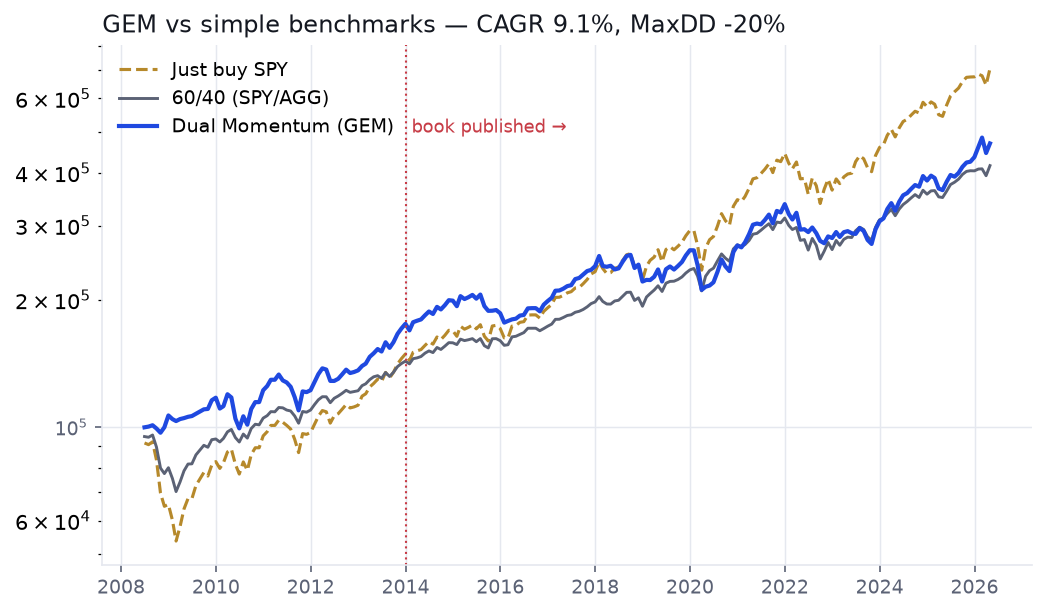
The headline claim checks out on risk: GEM's worst drawdown was −20% against SPY's −42%, because it was sitting in bonds through 2008–09. But look closer. Its return (9.1%) trailed simply holding SPY, and its risk-adjusted return — the Sharpe ratio — was the lowest of the three: a boring static 60/40 beat it at 0.84. Even including the crisis it was designed to survive, GEM didn't earn its complexity against a two-fund portfolio you never touch.
3 / The honest test: how has it done since the book?
Here's the check most write-ups skip. The book was published in 2014 on backtests running through roughly 2013. Everything after is out-of-sample — the fairest possible test of a published strategy. So how did GEM do over 2014–2026, live?
| Since 2014 (out-of-sample) | CAGR | Sharpe | Max drawdown |
|---|---|---|---|
| Dual Momentum (GEM) | 8.4% | 0.70 | −20% |
| Just buy & hold SPY | 13.6% | 0.94 | −24% |
| Static 60/40 (SPY/AGG) | 9.1% | 0.95 | −20% |
Out-of-sample, the story gets worse for GEM. It returned 8.4% a year while simply holding SPY returned 13.6% — a gap of more than five points a year, compounded over a decade. And the crown jewel, drawdown protection, quietly disappeared: GEM's −20% was barely better than SPY's −24%, and dead level with a static 60/40 that also drew down −20% while returning more. The thing GEM was supposed to buy you — safety — you got just as cheaply by never trading at all.
4 / What it was actually doing
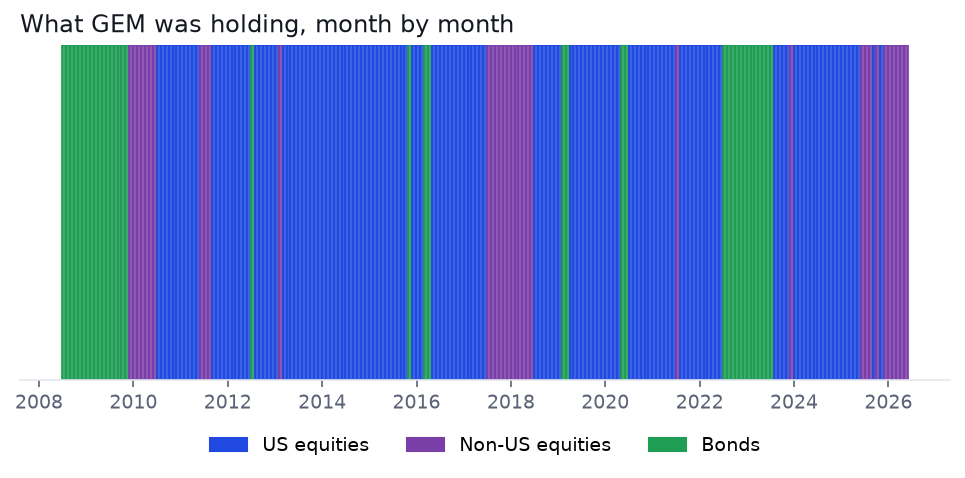
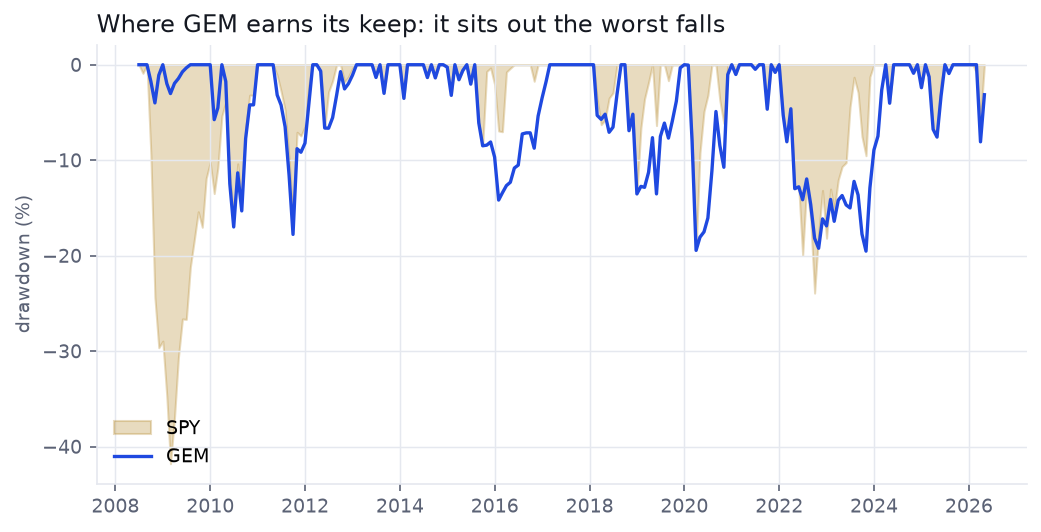
The allocation chart is the tell. GEM switched a total of 30 times in 18 years, and spent roughly two-thirds of that time simply holding US equities. Its good calls are real and visible — out of stocks in 2008, out again in 2020 and 2022 — but they're rare, and between them it whipsawed in and out of non-US stocks and bonds during choppy stretches (2011, 2015–16) that mostly just cost it the recovery. Most months, the "sophisticated tactical model" was recommending exactly what a buy-and-hold investor already owned.
Not broken — just beaten by boring.
Dual Momentum is a legitimate, well-constructed strategy, and it did the one thing it promised: it halved the 2008 drawdown by moving to bonds. But its reputation leans heavily on that single crisis. Measured against the right lazy benchmark — a static 60/40 you never touch — it trailed on risk-adjusted return over the full period, and out-of-sample since the book it lagged even a plain SPY by five points a year while giving up its drawdown edge. The lessons here outlast the strategy: always test a published system on the data that arrived after it was published, and always measure it against a benchmark that isn't cherry-picked. Complexity has to beat simple, out-of-sample, before it's worth your attention.
Pressure-test the next strategy you're sold
Learn · Module 5The validation gauntlet — out-of-sample, benchmarks, and why the backtest that sells a strategy rarely repeats Tool
Position Size & Risk of Ruin — put a number on the drawdowns you can actually live with More teardowns
See the same honest validation run on other published strategies