We rebuilt the Qullamaggie strategy with discipline. It still loses to the index.
Part 2 found a faint, real edge wrapped in three fixable-looking problems. So we fixed them — a regime filter, partial profit-taking, and an honest re-optimization. The improved build beats the raw one handily. It also loses to simply buying SPY on every axis. Here's the honest verdict, and where the edge really lives.
The story so far. Part 1 systematized Kristjan Kullamägi's published momentum rules — right shape, but a coin flip with a −48% drawdown. Part 2 tortured it: the drawdown was a regime story, the profit lived in ten trades, the edge died at 10 bps, and optimizing it didn't survive the Deflated Sharpe Ratio. The hypothesis for this finale: add the discipline the original trader supplies by hand, and see if a faint edge becomes a tradeable one.
The build / three additions, each from a Part 2 finding
- A regime filter. Part 2 showed the bear 19% of days held the entire drawdown — so the improved build only takes new entries when the S&P 500 is above its 200-day moving average.
- Partial profit-taking. Part 2 showed the whole edge lives in a thin tail of huge winners — so a full take-profit would be suicidal. Instead we bank half of each position at a take-profit and let the other half run on the moving-average trail.
- Volatility-aware sizing, gated by regime. Position size still scales inversely to each stock's stop distance, and now falls to zero in unhealthy markets.
The surprises / the obvious fixes weren't free
Two honest things happened on the way. First, the regime filter alone made the raw strategy slightly worse (a 0.9% CAGR versus 1.7%). A simple 200-day gate misses the violent V-bottom recoveries — momentum names rip before the index reclaims its average — and it can't unwind positions already opened before the market rolled over. The Part 2 decomposition told us where losses happened, not that one mechanical switch would remove them.
Second, when we let Optuna tune the take-profit, it pushed the threshold to its highest setting — i.e. it chose to let winners run further, confirming Part 2's lesson from the other direction: cap the fat tail and you kill the strategy. The pieces only paid off once tuned together.
The result / better than raw — and beaten by the index
The fully assembled, Optuna-tuned improved build is a real step up from Part 1. It is also comprehensively beaten by the laziest possible benchmark: buying and holding the index over the same 2015–2026 window.
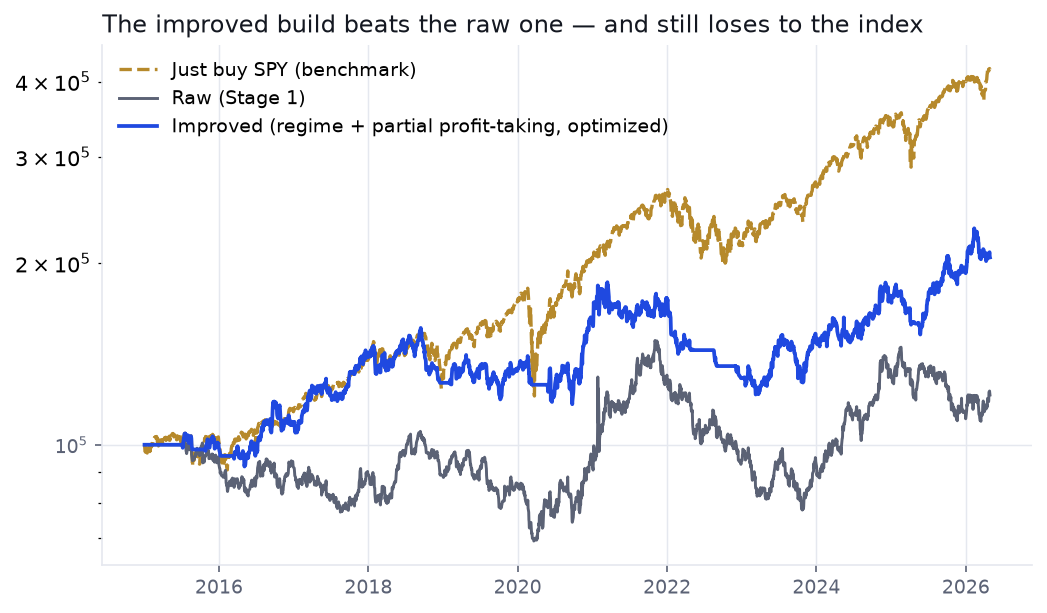
| Strategy (2015–2026, full sample) | CAGR | Sharpe | Max drawdown |
|---|---|---|---|
| Raw systematic (Part 1) | 1.7% | 0.19 | −48% |
| Improved (regime + partial profit-taking, optimized) | 6.5% | 0.45 | −35% |
| Just buy and hold SPY | 13.5% | 0.80 | −34% |
The improved build earns half the index's return at a lower Sharpe and a slightly worse drawdown — while demanding concentrated single-stock risk, constant active management, and (from Part 2) survivorship-flattered numbers. On a risk-adjusted basis you would have been comfortably better off doing nothing but holding a passive fund.
And honesty / it doesn't deflate, and it doesn't hold up out-of-sample
Even setting the benchmark aside, the improved build fails its own audit. We optimized on 2015–2020 and checked 2021–2026, then deflated the in-sample Sharpe for the 60 configurations we tried:
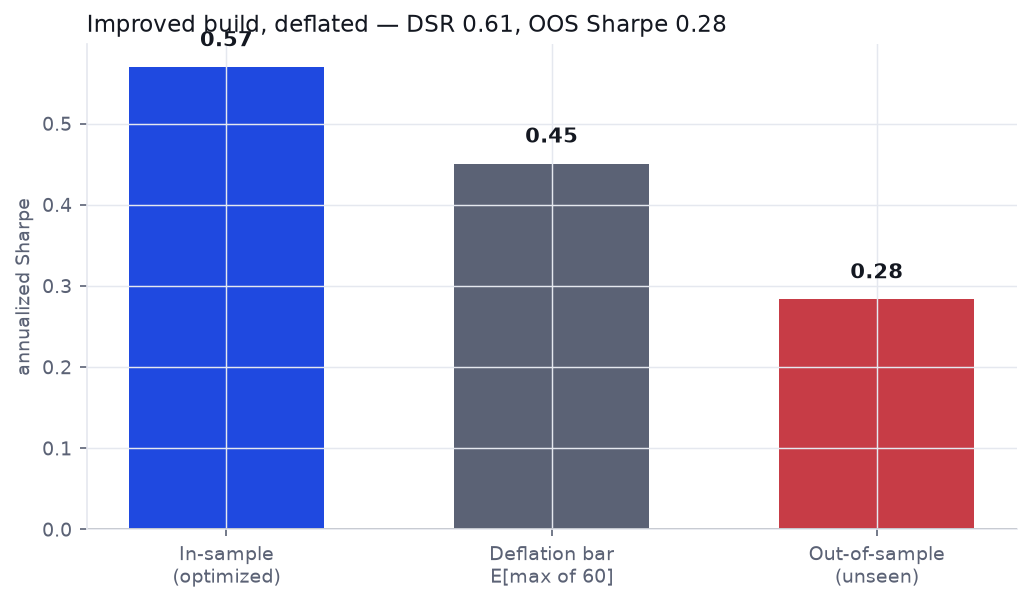
Out-of-sample the Sharpe drops to 0.28 with a −37% drawdown, and the Deflated Sharpe Ratio is 0.61 — short of the ~0.95 you'd want to call an edge real, and actually less convincing than the raw strategy's optimized result in Part 2. Adding machinery added parameters to overfit faster than it added genuine edge.
No-Go — not as a pure daily system.
The best mechanical version we could honestly build improves on the raw one, then loses to a passive index on return, risk-adjusted return, and drawdown at once; fails out-of-sample; and doesn't survive deflation. By any serious acceptance bar, you do not trade this — you buy the index and spend the saved effort elsewhere.
So where did the edge go?
Nowhere — it was never mostly in the rules. Kullamägi's published framework is real and sound, but our three teardowns keep pointing at the same conclusion: the extraordinary returns live in the discretion the rules don't contain. Which leaders, out of hundreds, to actually buy. Which bases are clean enough. When to press and when to sit out. How to feel a position's risk in real time. And the parabolic short he trades on one- and five-minute charts — an entire leg of his edge that a daily backtest cannot even see.
That is not a knock on him; it's the gap between a published framework and a master's application of it, and it's exactly the gap a mechanical system cannot inherit. The honest takeaway for a systematic trader isn't "momentum doesn't work" — it's that copying a discretionary legend's rule sheet is not the same as copying the legend, and only honest validation — costs, out-of-sample, deflation, a benchmark — tells you which is which before your capital finds out.
Run the same honest checks on your own system
ToolDeflated Sharpe Ratio — discount your optimized backtest for the search behind it Tool
Backtest Costs — find the break-even cost that decides gross-vs-net Guide
Backtest overfitting — why an in-sample curve and a tradeable edge are different things