Does the Squeeze Momentum (TTM / LazyBear) actually work?
Bollinger Bands inside Keltner Channels means “squeeze.” When the bands expand back out, retail scripts fire long or short with the momentum histogram. We rebuilt that rule clean-room and ran it on two decades of SPY and QQQ. The histogram looks decisive. The equity curve does not.
Credit. Volatility “squeeze” as Bollinger-inside-Keltner is John Carter’s TTM Squeeze idea (Mastering the Trade). The popular TradingView histogram is LazyBear’s Squeeze Momentum (linreg of price vs a high/low/SMA midline). Packaging we cite: Squeeze Momentum Indicator Strategy (LazyBear / PineIndicators). We reimplement the published idea in Python — no Pine source is used.
1 / The retail pitch
The default story everyone copies:
- Bollinger length 20, multiplier 2; Keltner length 20, TrueRange SMA × 1.5.
- Squeeze ON when the entire Bollinger envelope sits inside the Keltner channel.
- Momentum: linear-regression endpoint of
close − midlineover length 20 (LazyBear midline = average of mid-range and SMA). - Enter on the first bar the squeeze releases (was on, now off): long if momentum > 0, short if momentum < 0.
- Exit on the opposite release or when momentum flips sign.
We use the intended Bollinger multiplier of 2.0 (not the historical paste bug that wired KC’s multiplier into the BB width). Signal at the close; position from the next bar. Costs: fees 0, ~2 bps per side slippage (~4 bps round-trip; same order as ~1.5e−4 total friction).
Universe: yfinance adjusted daily SPY and QQQ, 2005-01-03 → 2026-09-04 (5,453 bars each). Alpaca SIP daily only reaches back to 2016 — too short for the “long history” claim this indicator is sold with — so the long Yahoo sample is the honest primary tape.
2 / SPY: the release does not beat holding
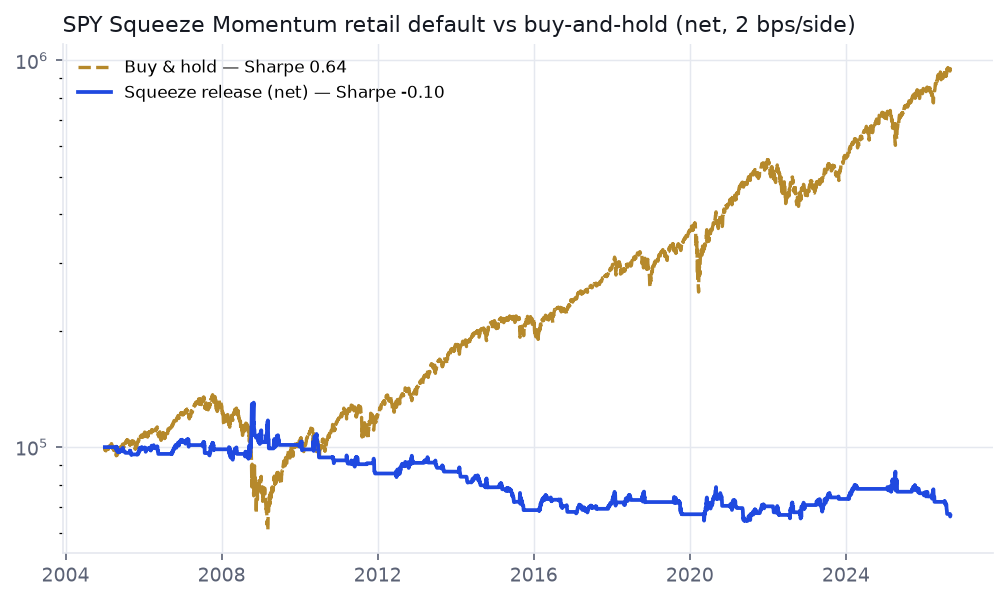
| SPY daily, 2005–2026 | CAGR | Sharpe | Max DD | Trades |
|---|---|---|---|---|
| Squeeze release default, net | −1.9% | −0.10 | −50.6% | 91 |
| Same rules, gross (0 cost) | −1.7% | −0.09 | — | — |
| Buy & hold SPY | 10.9% | 0.64 | −55.2% | — |
Ninety-one completed trades, win rate about 35%. Net Sharpe −0.10; gross is already −0.09. Break-even cost is effectively 0 bps — friction is not the villain. Out-of-sample with frozen defaults (last 30% of the sample, from 2020-03-04) the default Sharpe is a coin-flip 0.04. You sit through almost as much drawdown as buy-and-hold while giving back the entire equity premium.
3 / QQQ: same rule, worse tape
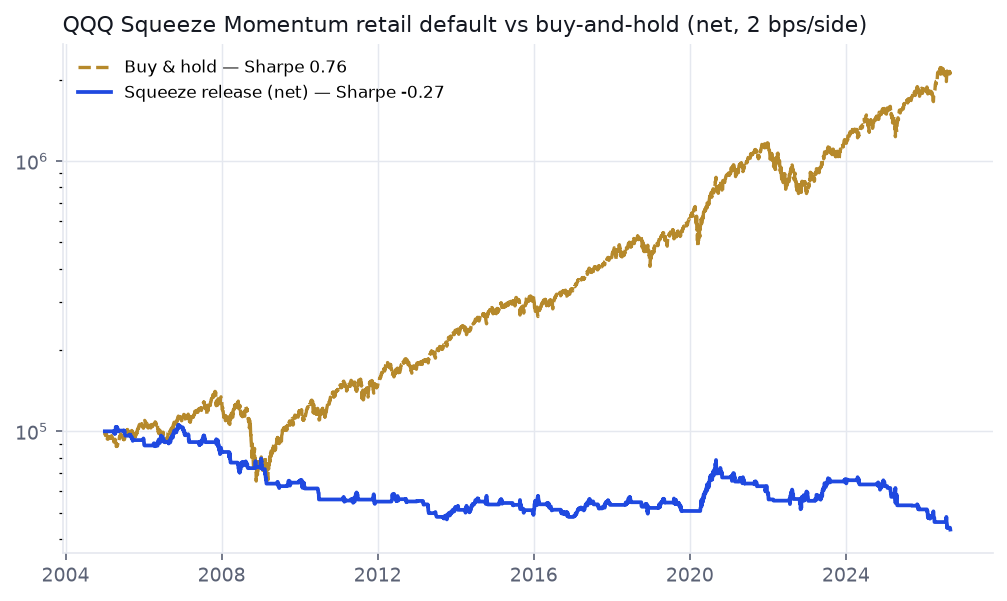
| QQQ daily, 2005–2026 | CAGR | Sharpe | Max DD | Trades |
|---|---|---|---|---|
| Squeeze release default, net | −3.8% | −0.27 | −59.1% | 100 |
| Same rules, gross (0 cost) | −3.6% | −0.26 | — | — |
| Buy & hold QQQ | 15.2% | 0.76 | −53.4% | — |
Win rate about 29% across 100 trades. Default OOS Sharpe −0.10. On a market with even more one-way drift, waiting for a squeeze then fading or chasing the histogram is a tax on trend — the same family of failure we saw when Supertrend met a ranging FX book, only here the “friendly” equity tape still loses.
4 / Costs: already underwater at zero
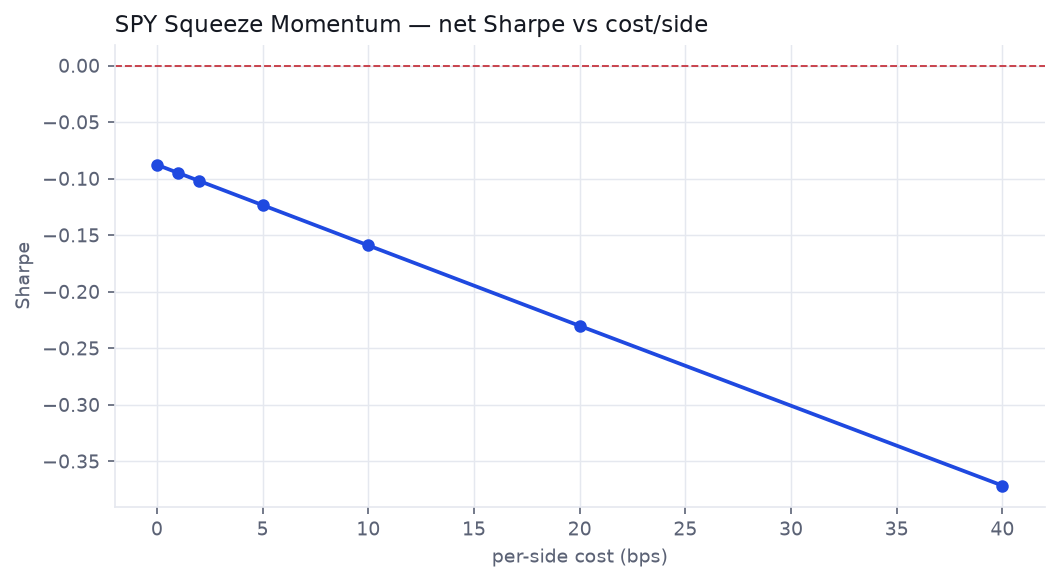
On SPY the cost sweep is monotonously bad: Sharpe −0.09 at 0 bps/side, −0.10 at our 2 bps assumption, −0.37 at 40 bps. QQQ mirrors it (−0.26 → −0.27 → −0.57). When you need a cost microscope, use the net-vs-gross calculator; here the system fails before the bill arrives.
5 / Tuning doesn’t rescue it — DSR says so
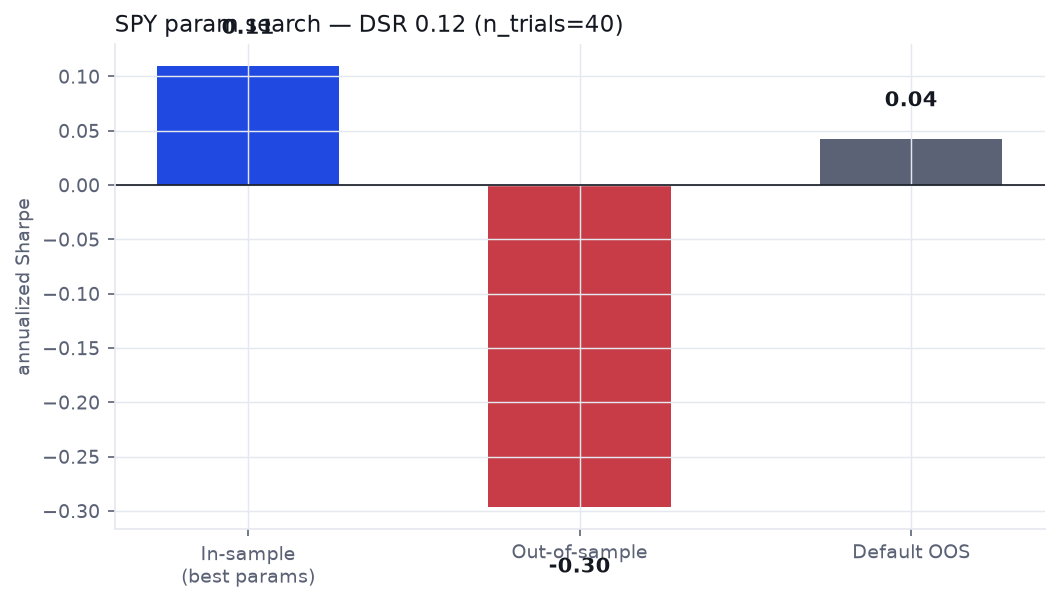
Maybe (20, 2, 1.5) is unlucky. We ran 40 Optuna trials per symbol over bb_mult ∈ [1.5, 3.0], kc_mult ∈ [1.0, 2.5], mom_len ∈ {10…30}, maximising in-sample net Sharpe on the first 70% of bars, then freezing the winner on the last 30%. Deflation uses the same Bailey & López de Prado machinery as our DSR tool.
| Search (40 trials, 70/30) | Best params | IS Sharpe | OOS Sharpe | DSR |
|---|---|---|---|---|
| SPY | (1.89, 2.29, 30) | 0.11 | −0.30 | 0.12 |
| QQQ | (1.51, 2.49, 25) | 0.21 | 0.49 | 0.10 |
QQQ’s tuned winner posts a tempting out-of-sample Sharpe of 0.49 — exactly the screenshot that goes viral. The Deflated Sharpe probability is only 0.10. After forty looks at the same tape, a lucky OOS print is not evidence. SPY’s winner never even clears a positive OOS (Sharpe −0.30, DSR 0.12). Neither clears a pre-committed ~0.95 bar.
Does not survive. We publish anyway.
The retail Squeeze Momentum release rule is a real, well-specified idea — and on long-history SPY and QQQ daily it is a negative-Sharpe system before costs matter. Parameter search finds soft in-sample peaks; Deflated Sharpe stays around 0.10–0.12. QQQ’s pretty OOS Sharpe after tuning is the trap, not the escape hatch. Editorial stance: failed DSR still gets a page, so the next person with a squeeze chart has a number to argue with — not a YouTube thumbnail. Untested next attempts (filters, higher timeframes, long-only-only, different exit color rules) stay off this page until they clear the same gauntlet.
Check the next claim the same way
ToolDeflated Sharpe Ratio — discount a tuned squeeze (or any search) for how many variants you tried Tool
Net-vs-Gross Costs — when friction matters; here gross already failed Related · Teardown
Supertrend on SPY vs EURUSD — another viral trail that lives or dies with regime Learn · Module 5
The validation gauntlet — overfitting, OOS, DSR, and costs in one place