Does the Supertrend indicator actually work?
It's one of the most-copied trails on TradingView: ATR period 10, multiplier 3, green = long, red = out (or short). We rebuilt the rule clean-room and ran the same defaults on two very different markets — SPY's multi-decade uptrend and EURUSD's long ranges. The indicator didn't change. The verdict did.
Credit. Supertrend is an ATR-based trailing stop popularised on TradingView; the best-known public script is Kıvanç Özbilgiç's SuperTrend. We reimplement the published trail logic (HL2 source, Wilder/RMA ATR, flip on break of the prior band) from scratch on our own data — no Pine source is used — and put it through the same validation as every teardown here.
1 / The pitch: one trail for every market
The retail pitch is simple enough to fit under a chart:
- ATR length 10, multiplier 3 — the near-universal default.
- When Supertrend is up, stay long (or flip long); when it flips down, exit or reverse.
- Sold as a set-and-forget trend follower that “works on stocks, FX, and crypto.”
That last claim is the one we test. A trend trail should look better when a market pays for lag with durable drift, and worse when price mean-reverts through the band. So we locked one code path and two universes on a shared calendar window (2005-01 → 2026-07):
- SPY daily, long-only — long when Supertrend is up, flat when down (how equity “Supertrend strategies” are usually sold).
- EURUSD daily, long/short flip — +1 up / −1 down (the natural FX version of “always in”).
Costs are modest but real: 2 bps per side of notional on both (for EURUSD, roughly a couple of pips of friction in price terms — we document that as an approximate retail-class assumption, not a bank desk quote). Signal at the close, position on the next bar.
2 / SPY: quieter ride, half the return
On the S&P 500 ETF, Supertrend (10,3) long-only is not a disaster — and it's not free alpha either.
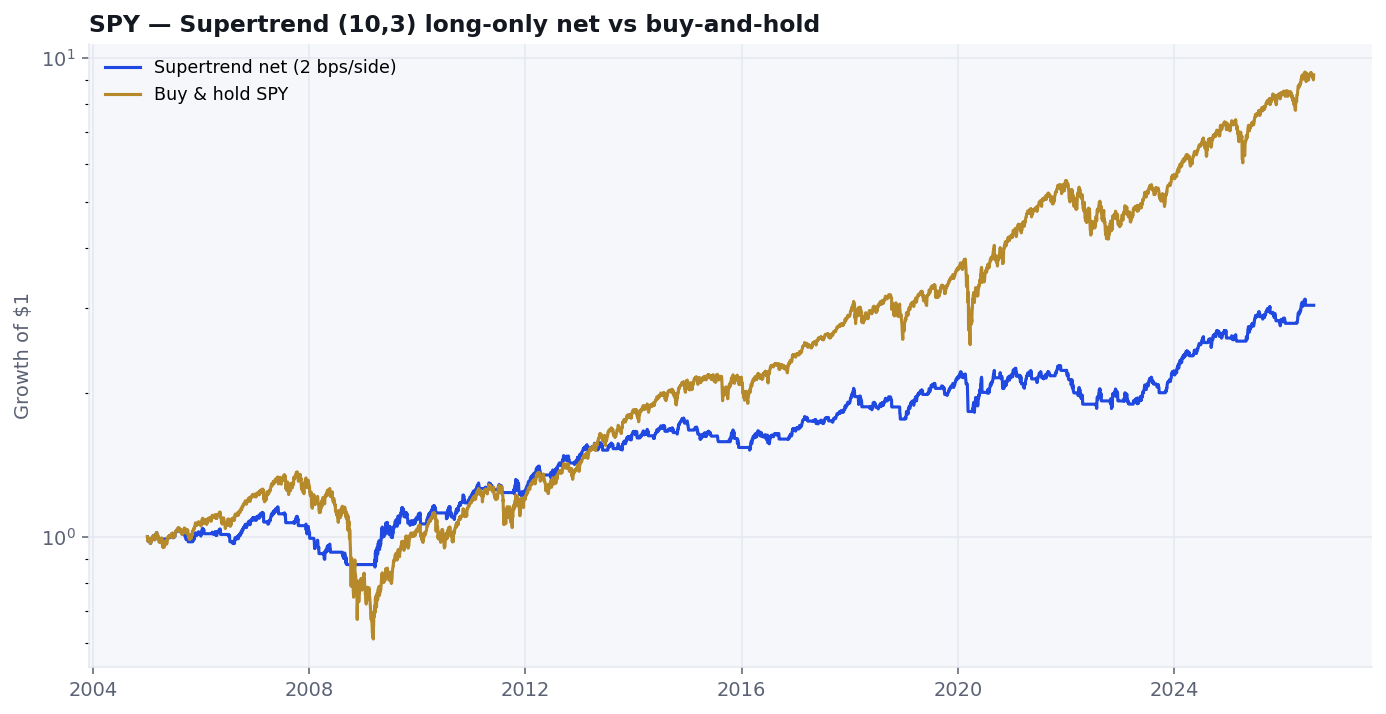
| SPY daily, 2005–2026 | CAGR | Sharpe | Max DD | Trades |
|---|---|---|---|---|
| Supertrend (10,3) long-only, net | 5.3% | 0.55 | −25.1% | 87 |
| Buy & hold SPY | 10.9% | 0.64 | −55.2% | — |
Net of costs the trail posts about a 0.55 Sharpe and 5.3% CAGR, with a −25% max drawdown — roughly half the pain of buy-and-hold's −55%. The win rate of completed trades is a forgettable 52%. Gross vs net barely moves (0.56 → 0.55): at daily equity turnover this low, 2 bps is not the story.
The honest reading is the same family as volatility targeting: Supertrend on a structural bull market is a risk-shape tool, not a return engine. You sit out some of the worst equity holes, and you also sit out enough upside that the buy-and-hold line quietly doubles your CAGR. Out-of-sample (2020–2026) the default still runs a net Sharpe around 0.52 — positive, not magical.
3 / EURUSD: the same trail gets chopped
Apply the identical (10,3) rule to EURUSD as a long/short flip and the “works on everything” claim collapses.
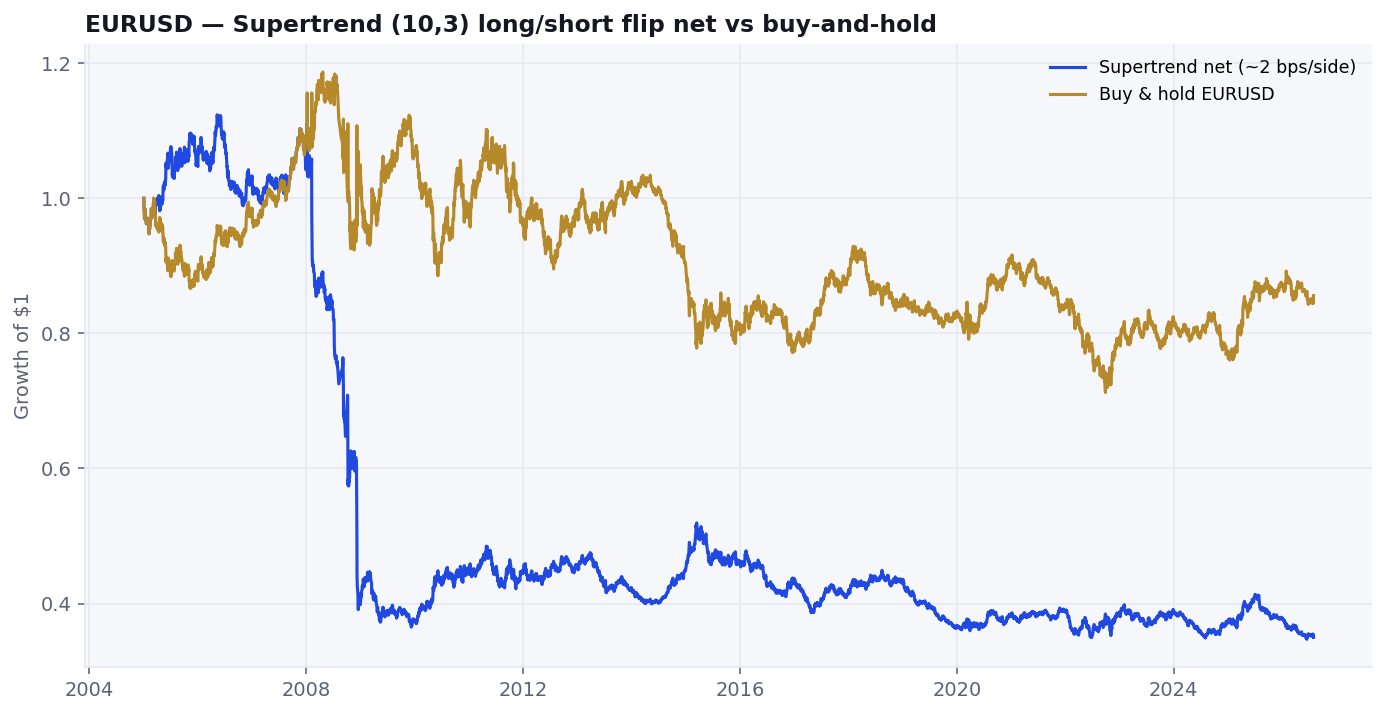
| EURUSD daily, 2005–2026 | CAGR | Sharpe | Max DD | Trades |
|---|---|---|---|---|
| Supertrend (10,3) long/short, net | −4.6% | −0.37 | −69.1% | 146 |
| Supertrend long-only (same rules) | −2.3% | −0.29 | −52.2% | — |
| Buy & hold EURUSD | −0.7% | ≈0.00 | −40.0% | — |
The flip system ends down about 65% in total, Sharpe −0.37, max drawdown about −69%, with a 34% trade win rate across 146 completed flips. Even the long-only version (flat on down signals) still loses. Buy-and-hold EURUSD is nearly driftless over this window — Supertrend doesn't need a bull market to fail; it only needs enough mean reversion and whipsaw to pay the trail lag over and over. Out-of-sample the default flip stays slightly negative (Sharpe about −0.06).
4 / Head-to-head: regime, not magic numbers
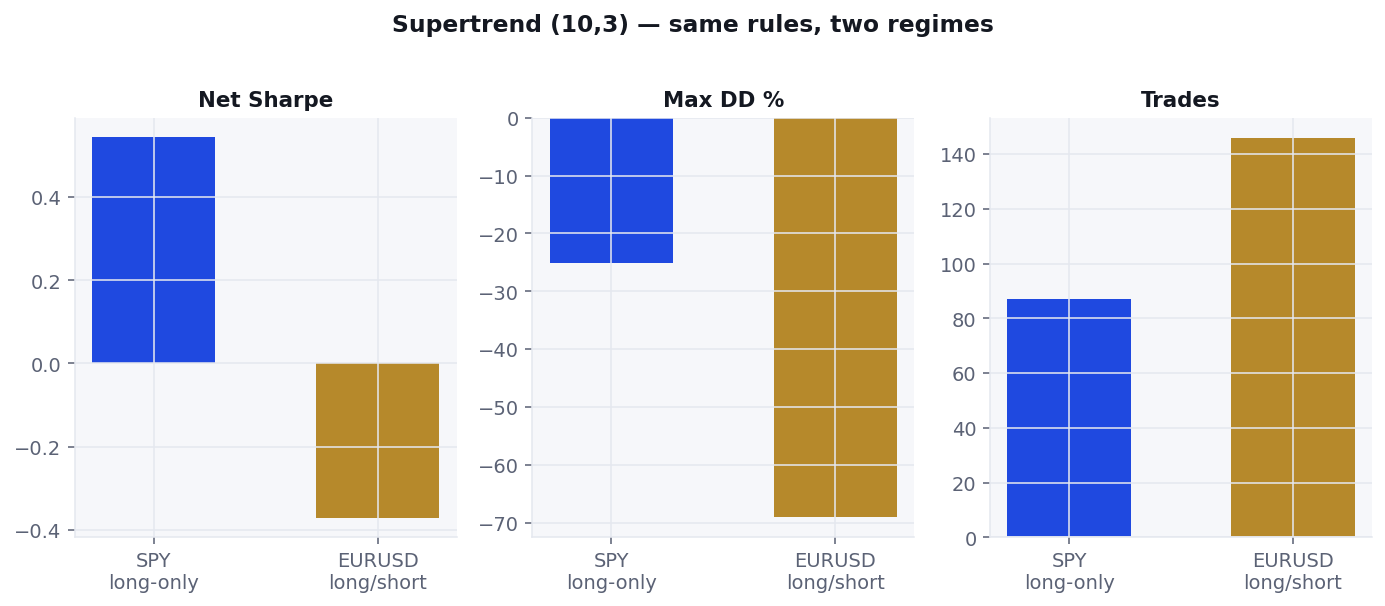
Put the two side by side and the lesson is almost too clean:
- Relatively better on SPY — a market with a long-run equity premium, where going flat in down Supertrend regimes cuts left-tail equity risk (at the cost of return).
- Relatively worse on EURUSD — a market without that premium, where the trail's lag is mostly a tax on reversals.
This is the same spirit as our MACD-across-regimes piece: the backtest is always a bet on the regime you sampled. Supertrend doesn't get a free pass because the chart looks tidy on a bullish daily SPY.
5 / Costs: not the villain on equities; irrelevant once FX is broken
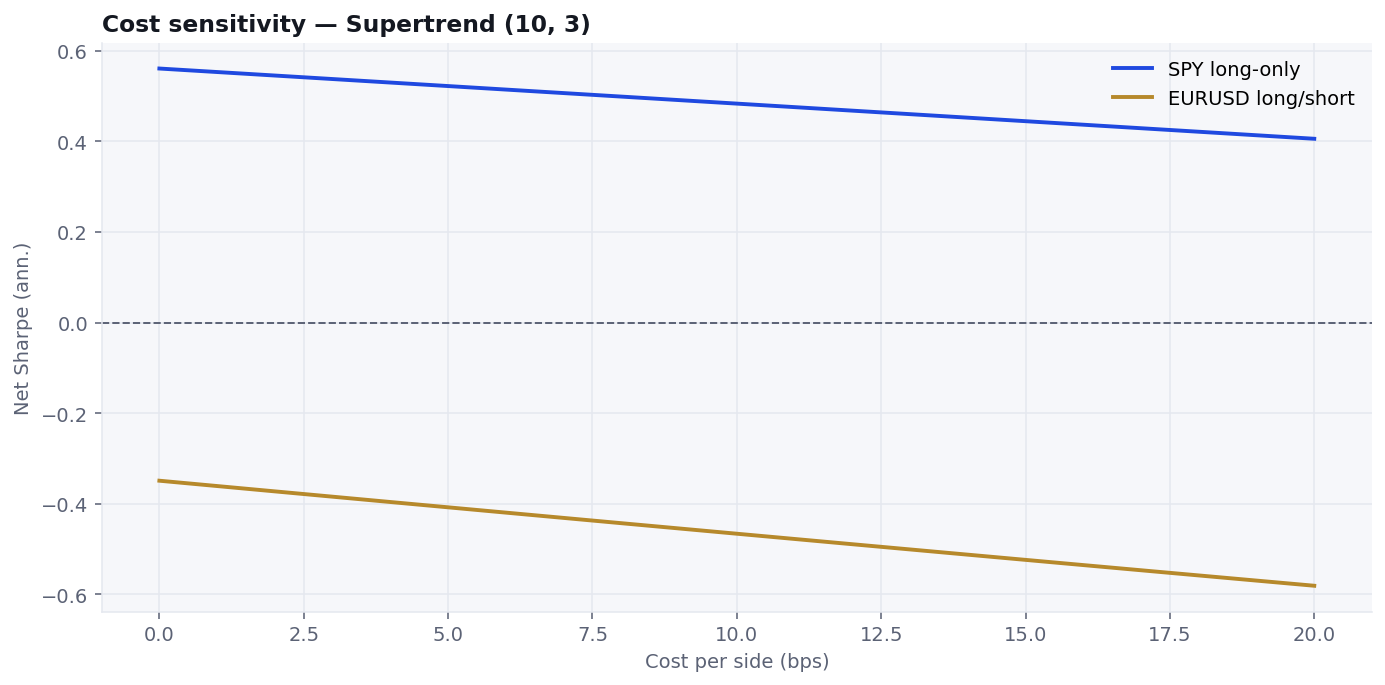
On SPY the default long-only trail is still positive until roughly 70+ bps per side — far above our 2 bps assumption — so “costs killed Supertrend on equities” is the wrong story. On EURUSD the break-even is effectively zero: the gross Sharpe is already negative (about −0.35). Friction makes a bad system worse; it does not invent the badness. When you need a cost microscope, use the net-vs-gross calculator; here the FX result fails before the bill arrives.
6 / Tuning doesn't rescue it
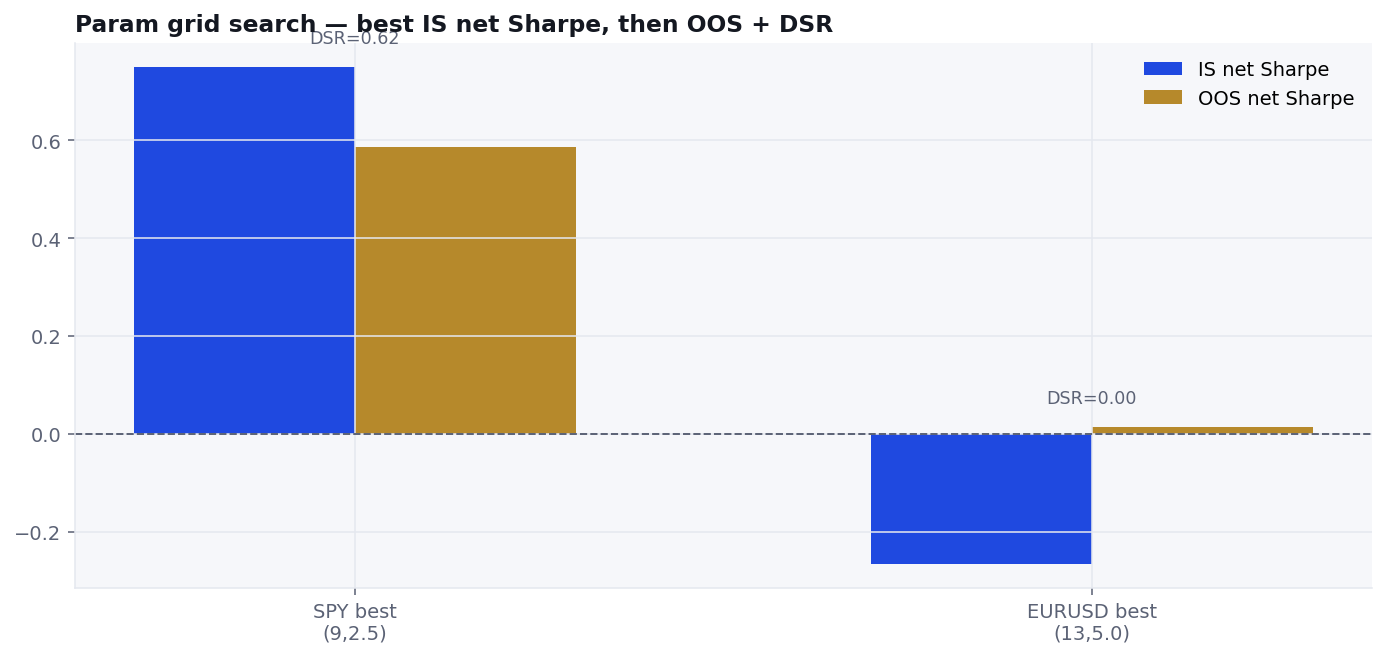
Maybe (10,3) is just unlucky. We ran a grid of 120 variants per market — ATR period 7–21, multiplier 1.5–5.0 — maximising in-sample net Sharpe through end-2019, then freezing the winner for 2020–2026 out-of-sample, and deflating for the full search with the same Bailey & López de Prado machinery as our DSR tool.
| Search (120 trials each) | Best params | IS Sharpe | OOS Sharpe | DSR |
|---|---|---|---|---|
| SPY long-only | (9, 2.5) | 0.75 | 0.59 | 0.62 |
| EURUSD long/short | (13, 5.0) | −0.27 | 0.01 | ≈0.00 |
SPY's best in-sample setup still posts a healthy out-of-sample Sharpe (~0.59), but the Deflated Sharpe probability is only 0.62 — nowhere near the ~0.95 bar you'd want before calling a search result “real.” EURUSD's “best” in-sample peak is still negative; out-of-sample it's a coin-flip near zero; DSR is essentially zero. Transfer check: SPY's best params on EURUSD out-of-sample still lose (Sharpe about −0.19). EURUSD's wide multiplier (5.0) happens to look strong if you paste it onto SPY out-of-sample — which mostly says “trade less on equities,” not “EURUSD discovered an edge.”
Conditional, and mostly not a tradeable edge.
Supertrend is a real trail, not a scam. On SPY the default long-only version is a quieter equity path: lower drawdown, lower return, Sharpe a bit under buy-and-hold — useful as a risk-shape story, weak as an alpha story, and not strong enough under multiple testing (DSR 0.62 on the best grid winner). On EURUSD the same defaults get chopped: negative Sharpe, deep drawdown, worse than doing almost nothing. The market regime decides more than the viral defaults. If a chart only shows Supertrend on a long bull market, you're looking at the flattering half of the picture — the half our validation gauntlet is built to question.
Check the next claim the same way
ToolDeflated Sharpe Ratio — discount a tuned Supertrend (or any search) for how many variants you tried Tool
Net-vs-Gross Costs — when friction matters; here it doesn't save EURUSD Related · Teardown
MACD across regimes — another “simple rule” that lives or dies with the sample market Learn · Module 5
The validation gauntlet — overfitting, OOS, DSR, and costs in one place